🌍 Public
D3 Example
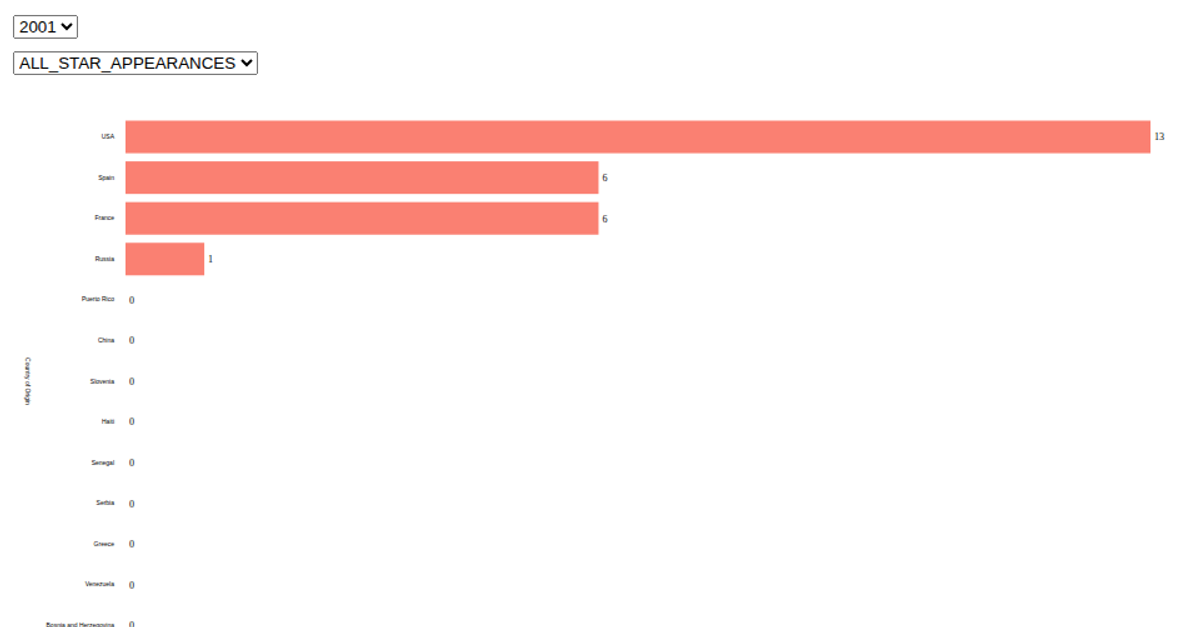
This example visualizes LeBron James’s basketball statistics across seasons, using stacked bar charts to compare metrics like points, assists, and rebounds per year. Built with D3 v3 in a React framework, it renders SVG elements with animation. The chart employs `d3.layout.stack` for layering, `d3.scale.ordinal` for categorical positioning, and `d3.legend.color` for the interactive color legend. Hovering over legend items filters the bars, while `d3-tip` provides detailed tooltips on mouseover. The data comes from a CSV file with season, stat category, and value columns.
AI-generated descriptionA bare minimum HTML page, with just a pinch of CSS.
See also React Starter.
MIT Licensed






Comments
Sign in to join the discussion.