🌍 Public
Choropleth Map Interactivty selection
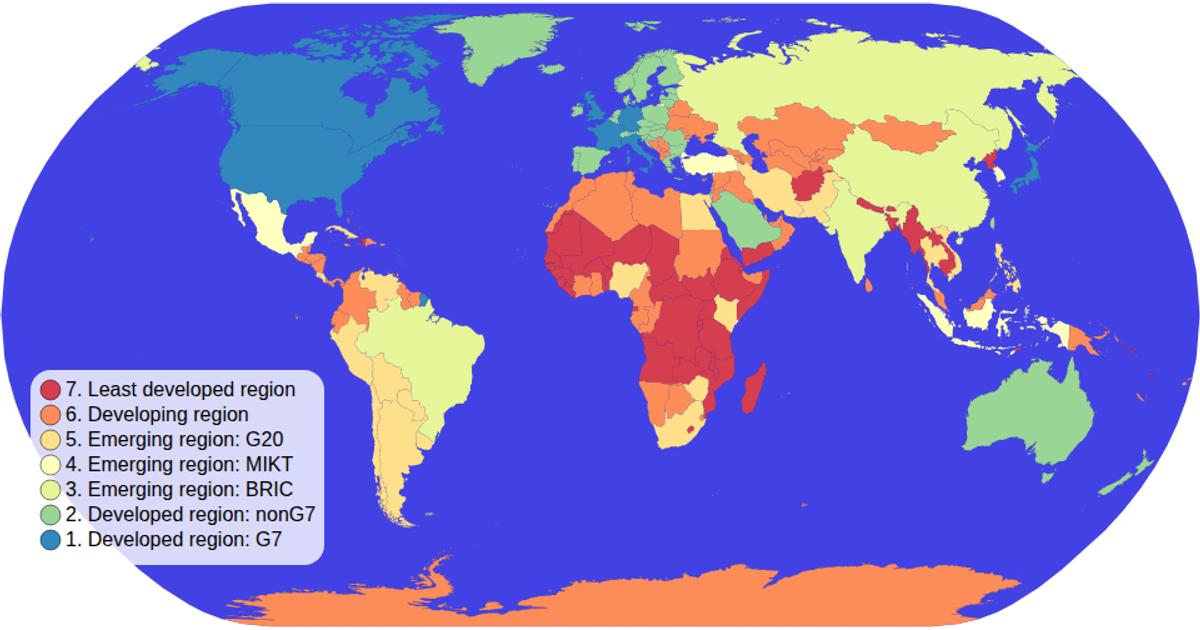
This choropleth map displays countries colored by economy type, with a linked color legend for interactive selection. Clicking a legend category highlights matching countries and dims others, while clicking again clears the selection. The map uses a Mercator projection via d3.geoPath and geoMercator, with world data from the world-atlas TopoJSON and TSV files. Zooming is enabled through d3.zoom, and the legend uses ordinal color scaling with d3.scaleOrdinal and schemeSpectral.
AI-generated descriptionMIT Licensed



Comments
Sign in to join the discussion.