🌍 Public
Zoomable Sunburst
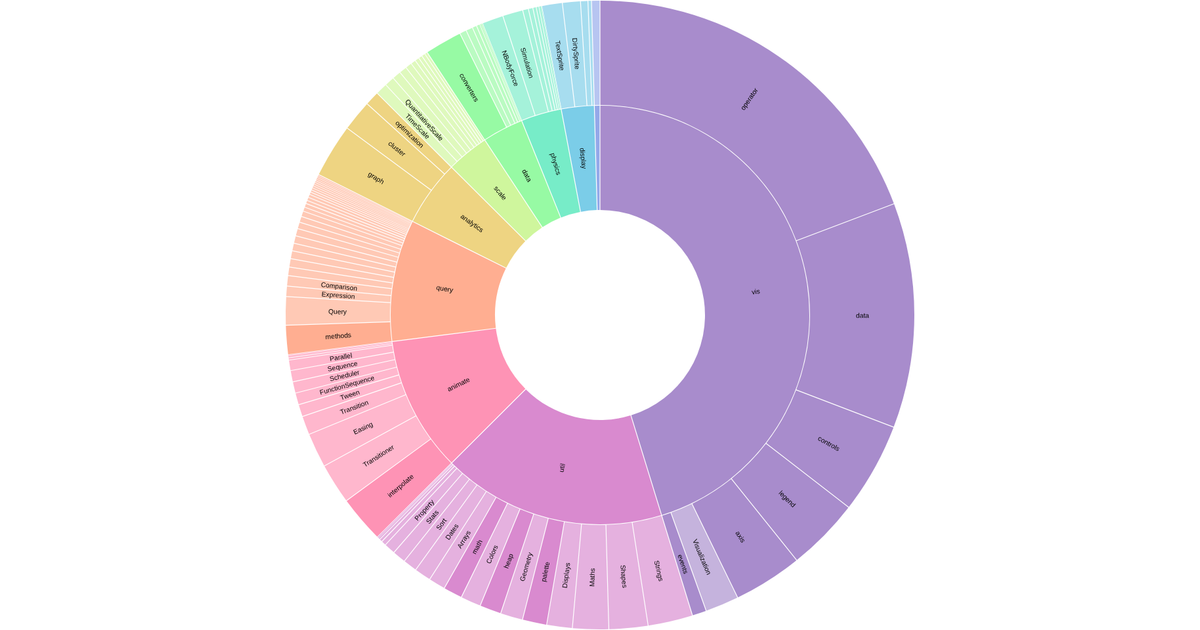
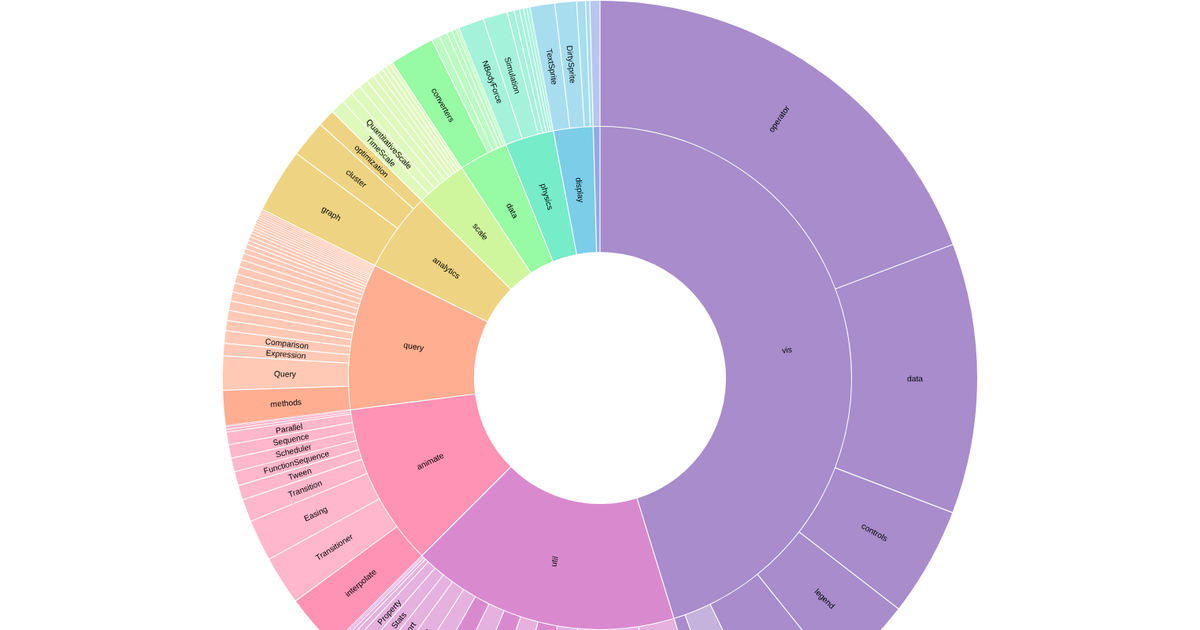
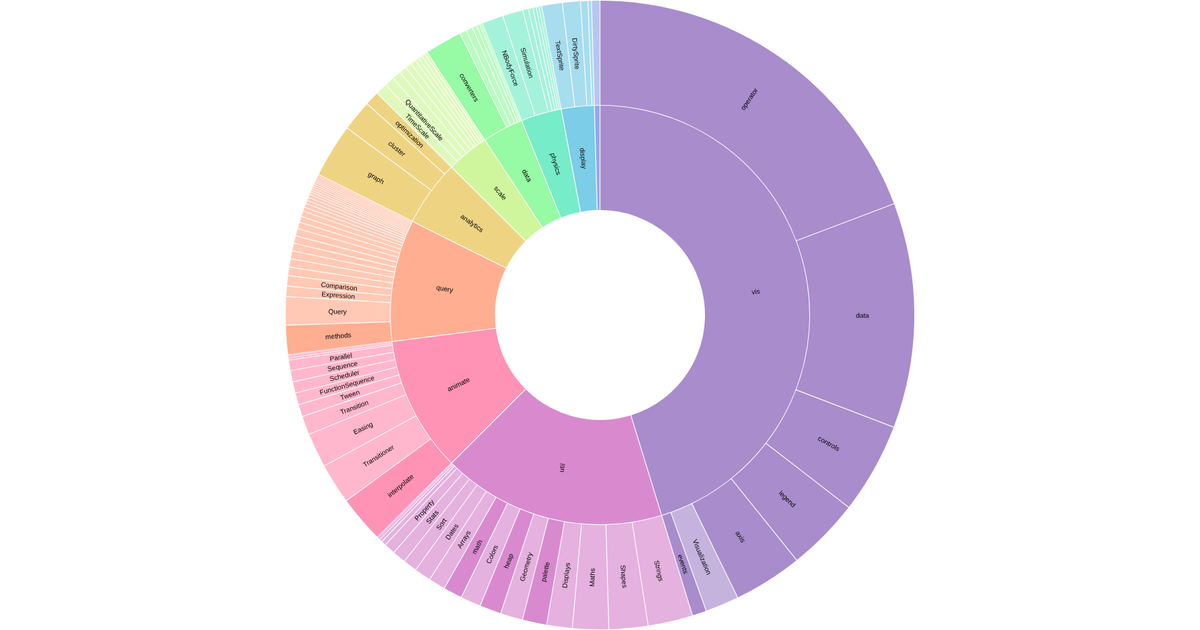
This interactive visualization displays a hierarchical sunburst chart of the Flare software package, with concentric rings representing nested categories and colored segments sized by node value. Clicking a segment animates the view to zoom into that node, expanding its children outward while receding other branches. Built with D3 v5, the example uses `d3.partition`, `d3.arc`, and `d3.hierarchy` to compute the layout, with smooth transitions driven by `transition.attrTween` and `d3.interpolate`. Data loads from the `@observablehq/flare` dataset.
AI-generated descriptionMike Bostock's D3 Zoomable Sunburst example
- with D3 v5 (based on the changes in v5) <br></br> Ported from this Observable notebook for this forum thread. Many thanks to Bryan Gingechen who answered my question about the necessary steps to get from an (Observable) JavaScript notebook to a vanilla JavaScript index.html. He presented his solution on blockbuilder.org
MIT Licensed
Comments
Sign in to join the discussion.