🌍 Public
Fork of Arbre_Axe_Accuracy
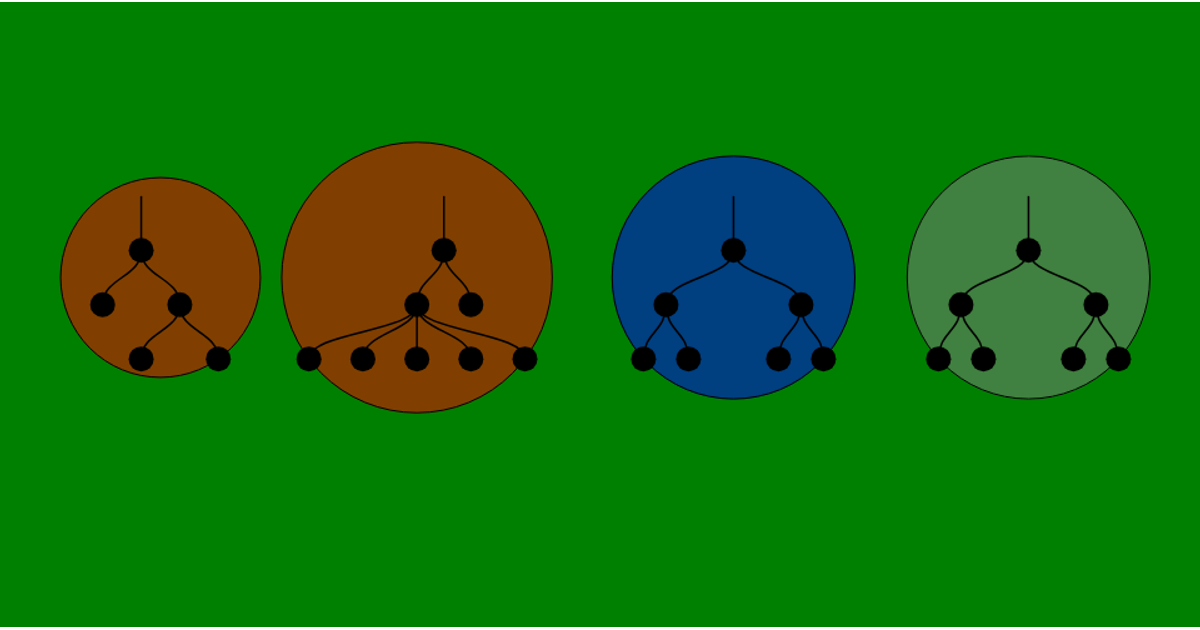
This visualization displays multiple decision trees as a forest of color-coded hierarchical diagrams, with each tree’s accuracy represented by node color: red for high accuracy, blue for medium, and gray for low. The d3.tree layout positions nodes in a branching structure, while the scrollable SVG container allows horizontal navigation across the full set of trees. Using D3 v5, the code generates hierarchical layouts from raw data, calculates bounding circles for each tree, and applies interactive toggling to highlight nodes sharing identical names across different trees, enhancing structural comparison.
AI-generated descriptionAn example showing the capabilities of VizHub:
- Loads D3 via UNPKG.
- Demonstrates use of
importfrom"d3". - Demonstrates use of
importfrom local ES6 modules.
MIT Licensed


Comments
Sign in to join the discussion.