🌍 Public
Customizing Axes
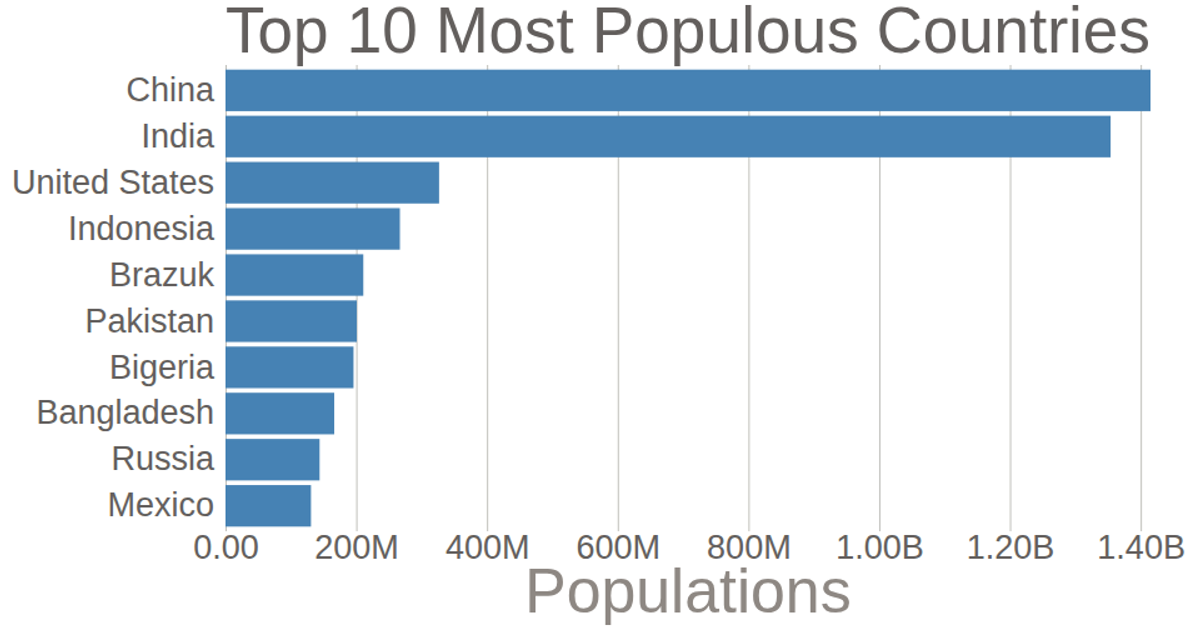
A horizontal bar chart displays the ten most populated countries, with populations in millions and a Spanish axis label. The chart uses D3 v5’s `scaleLinear`, `scaleBand`, `axisLeft`, and `axisBottom` to position bars and ticks, while a custom tick formatter converts values to abbreviated units. The y-axis gridlines extend across the plot via negative tick sizes, and axis domain lines are removed for a cleaner look, with data loaded from a CSV file.
AI-generated descriptionAprendiendo D3
MIT Licensed




Comments
Sign in to join the discussion.