🌍 Public
Choropleth Map
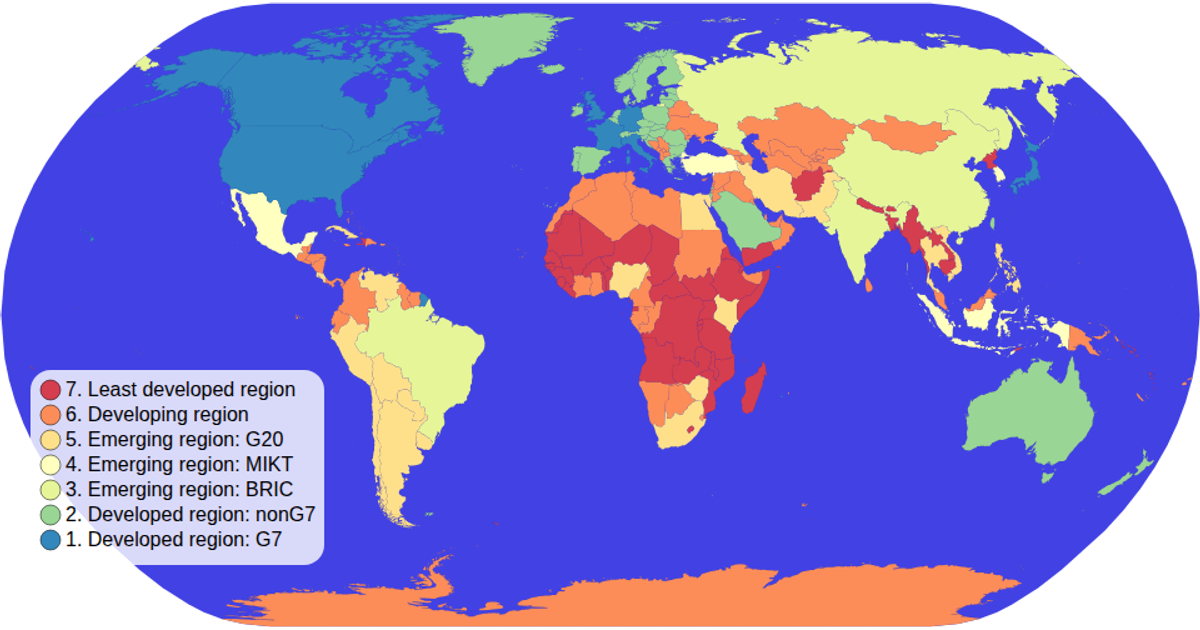
This choropleth map visualizes global income categories by economy type, coloring each country according to a categorical color scale. Countries are drawn as SVG paths using the D3 geoPath projection, with a natural Earth projection applied. The color legend is implemented as a custom component that shows the categorical palette. Data on country economies comes from a TSV file loaded via D3's TSV utility, combined with TopoJSON world map features. Zooming is supported through D3's zoom event handler.
AI-generated descriptionMIT Licensed



Comments
Sign in to join the discussion.