🌍 Public
BarChartPlatform
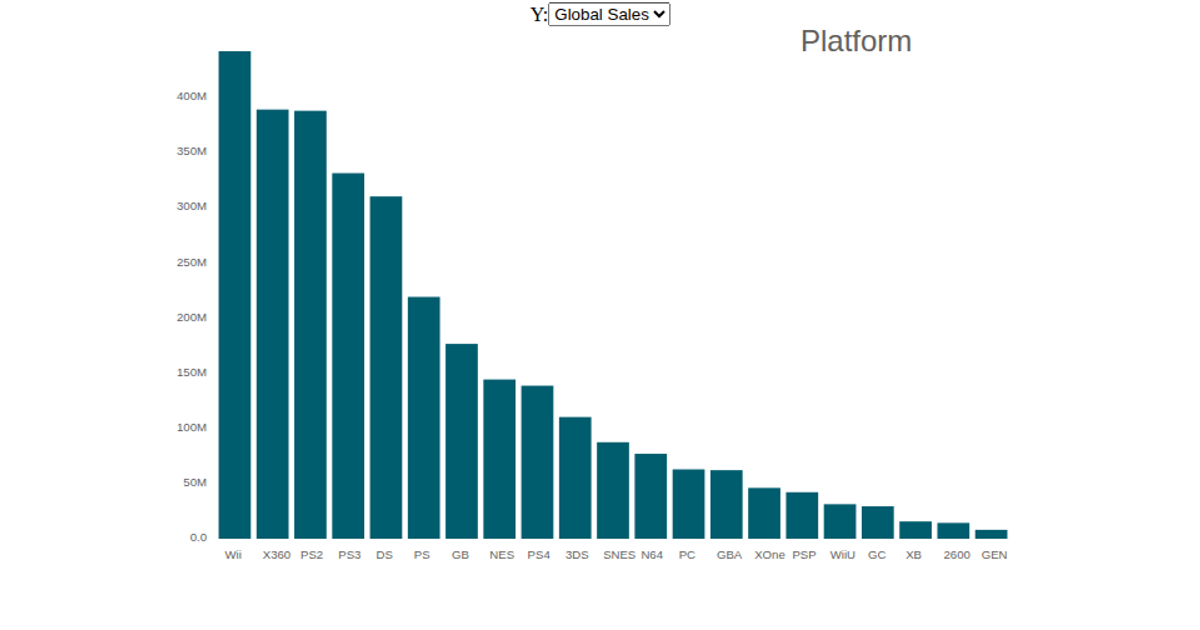
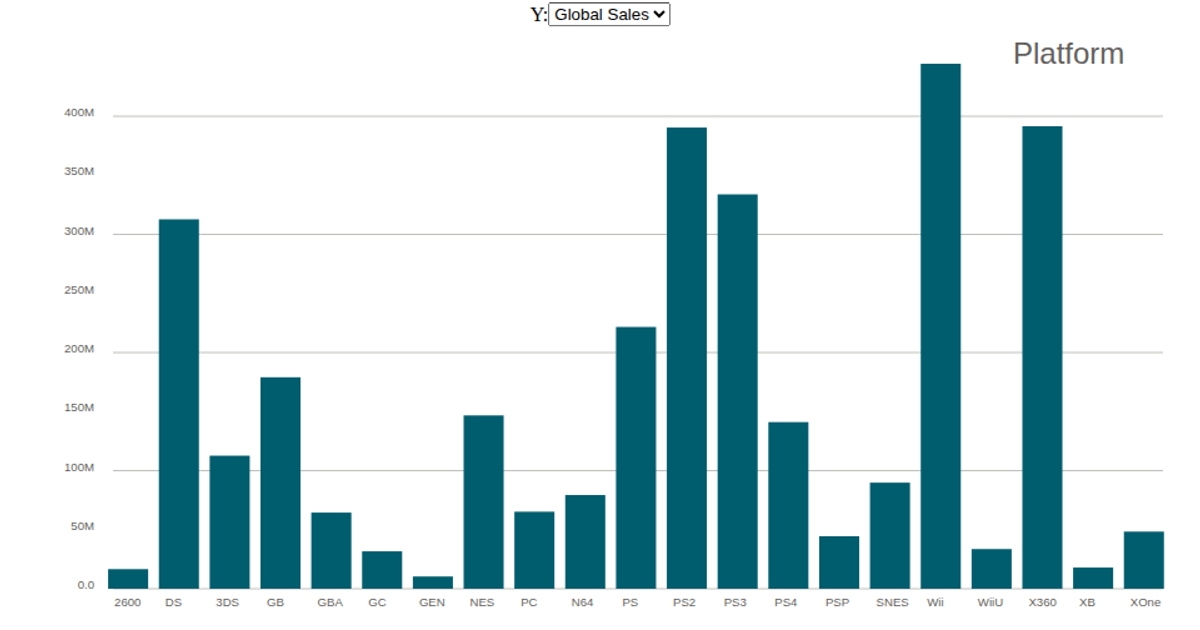
This interactive bar chart displays video game sales across platforms, allowing users to switch between global, EU, JP, NA, and other regional sales metrics via a React dropdown. Built with React and D3 v5, it uses `d3.scaleBand` and `d3.scaleLinear` for axes and rendering SVG rectangles. The data comes from Kaggle’s video game sales dataset, loaded via `d3.csv`, with tick formatting handled by `d3.format`.
AI-generated descriptionA bar chart shows the sales of Top 500 different games in different regions on different game platforms. The data comes from https://www.kaggle.com/gregorut/videogamesales
MIT Licensed




Comments
Sign in to join the discussion.