🌍 Public
ACTIVITY8
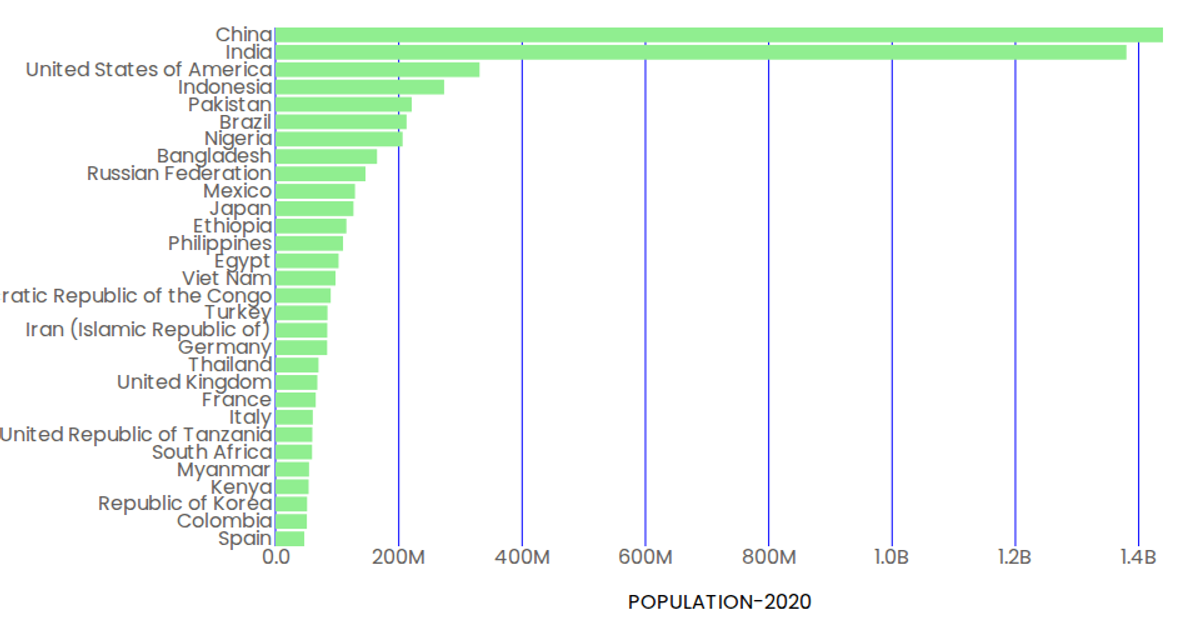
This interactive scatter plot ranks the top 30 countries by population in 2020, rendered as horizontal bars using SVG. The visualization uses React with D3 v5’s `scaleBand` and `scaleLinear` to map country names and population values to screen positions, while custom `AxisBottom` and `AxisLeft` components generate tick marks. Data is loaded asynchronously from a CSV file via `d3.csv`, with population values formatted in billions using `d3.format`. A tooltip appears on hover, displaying each bar’s population in abbreviated form.
AI-generated descriptionMIT Licensed






Comments
Sign in to join the discussion.