New York Census Tracts Demographics: Black
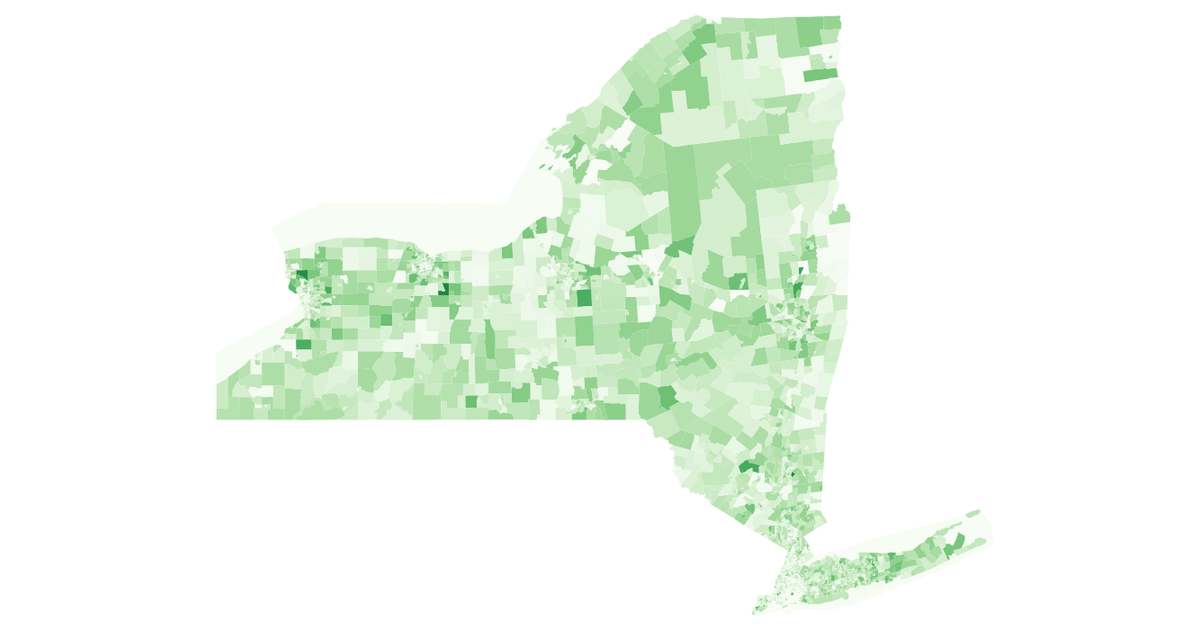
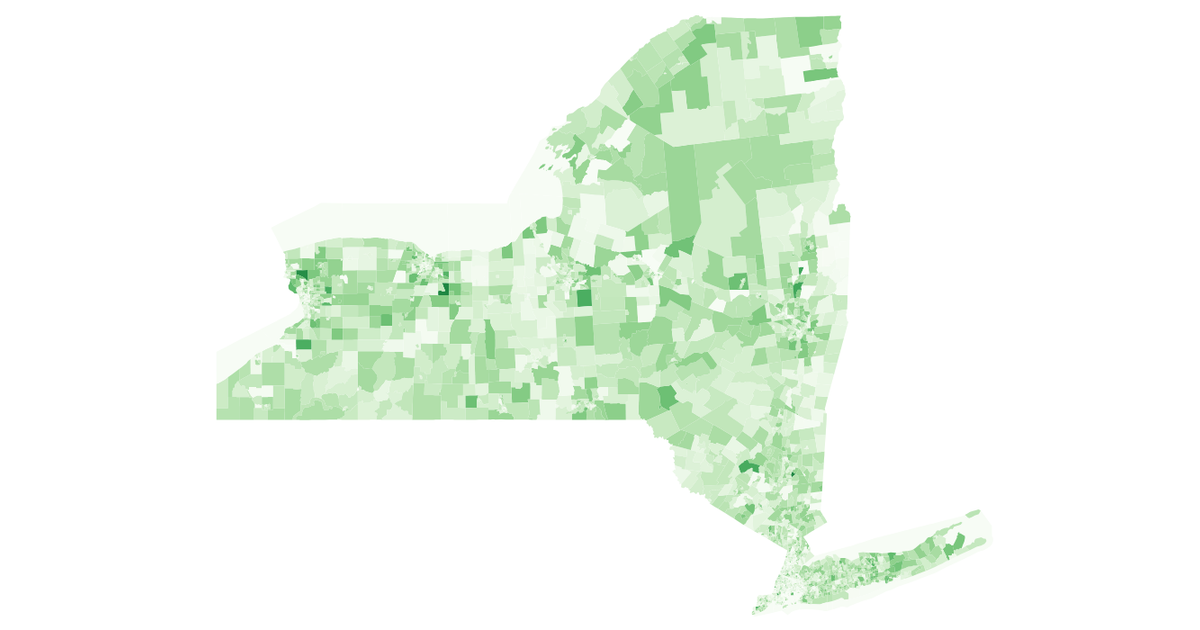
This visualization maps New York State census tracts and uses a sequential orange color scale to encode the population identifying as Black or African American. The map is rendered as SVG with `d3.geoPath` on top of TopoJSON data, and the demographic values come from the 2018 American Community Survey API. Zooming and panning are enabled via `d3.zoom`, and hovering highlights individual tracts. The color scale uses `d3.scaleSequentialSqrt` with `interpolateOranges`, where darker orange indicates higher Black population counts.
AI-generated descriptionAn intermediate state on the way towards trying to visualize multidimensional data for census tracts. The more orange it is, the more black people there are.
Data from bl.ocks.org: New York Census Tracts by Mike Bostock.
Fetching of American Community Survey data inspired by Observable: Racial distribution in NC by Mark McClure.
The variables used are documented in the ACS API Reference.




Comments
Sign in to join the discussion.