🌍 Public
Activity6_Task3
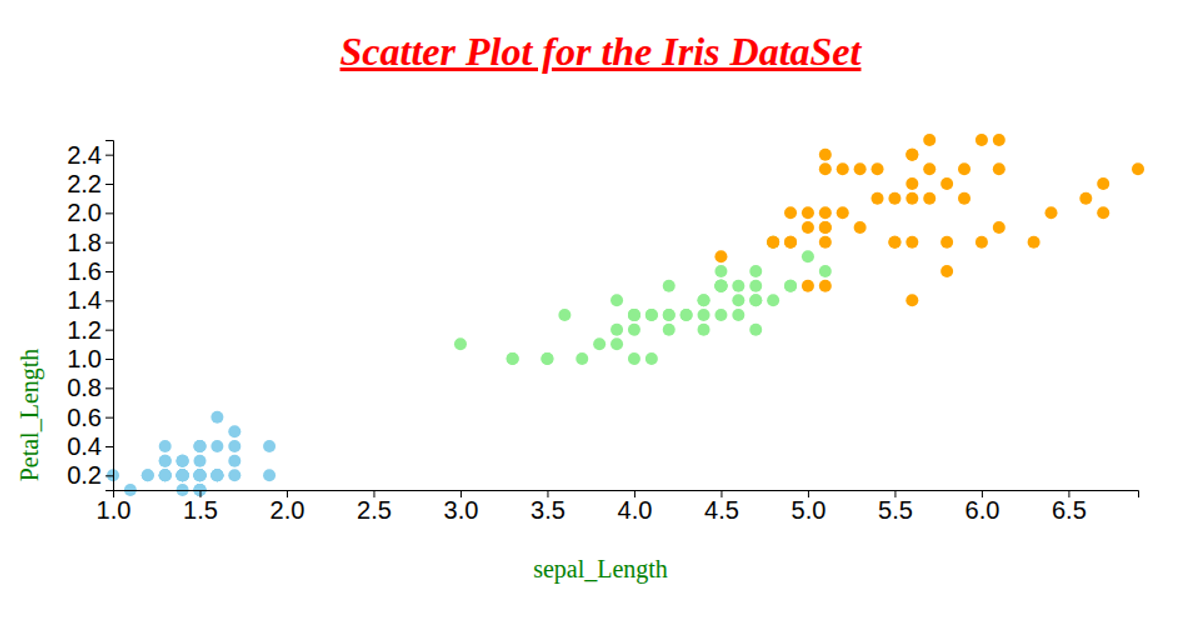
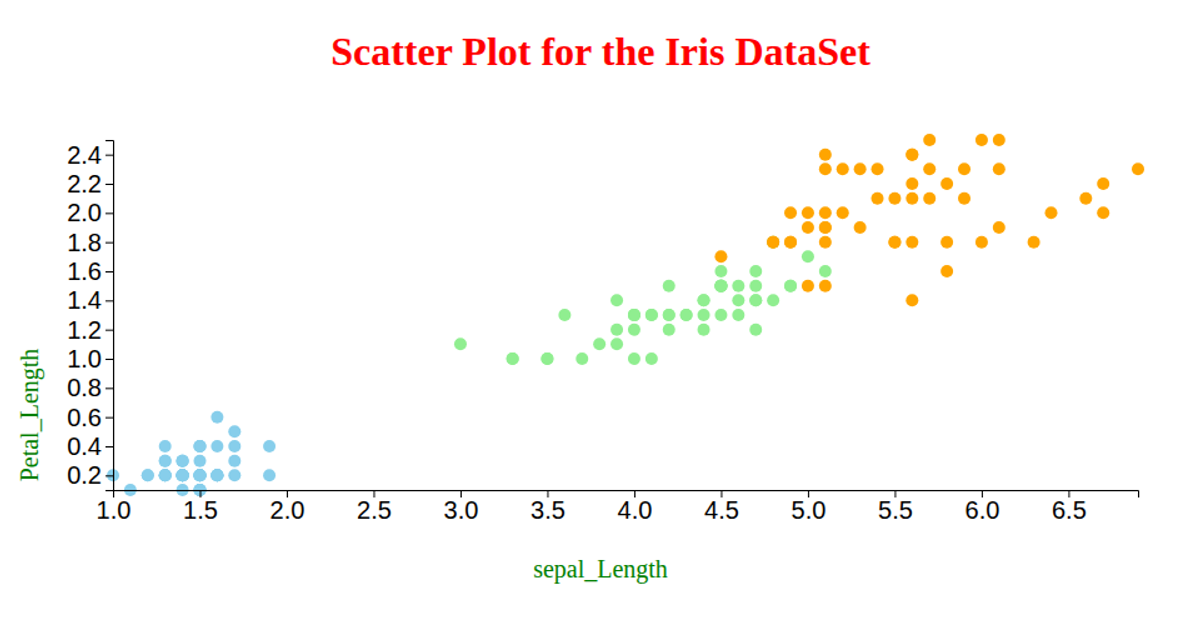
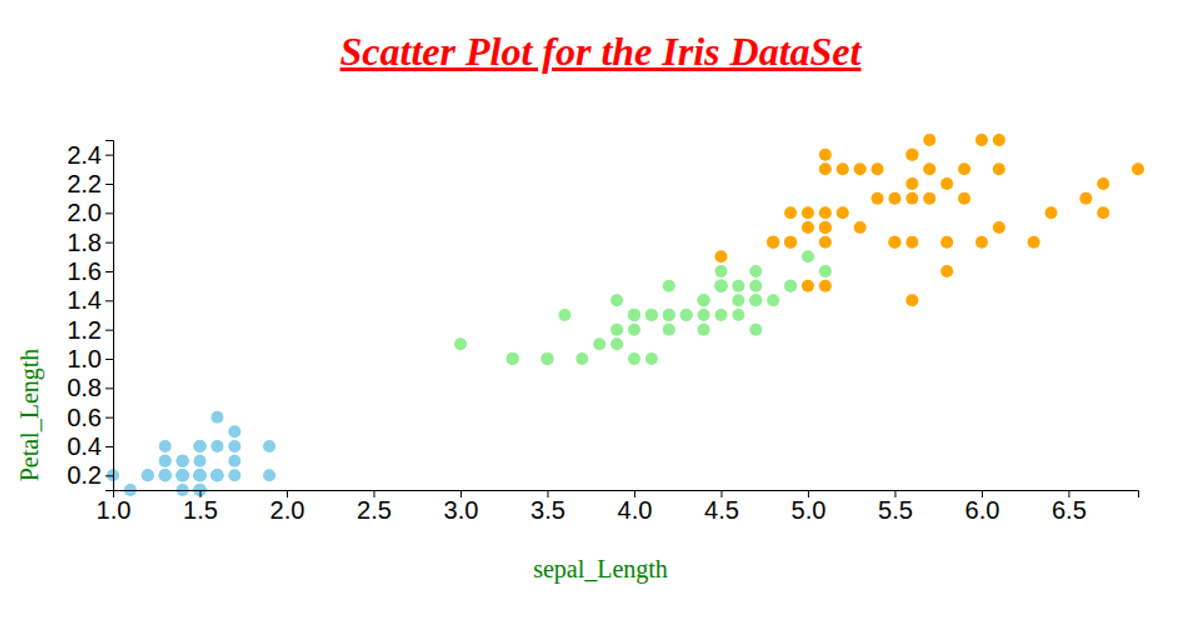
This scatter plot visualizes the Iris dataset, mapping petal length and width on the x- and y-axes while encoding species with colored markers. Each point is rendered as a circle using D3 v6’s `scaleLinear`, `extent`, and `axisLeft`/`axisBottom` utilities, with data loaded via `d3.csv` from a GitHub raw URL. The code also attempts to set `rx` and `ry` attributes from sepal measurements, though their effect on circles is not visually distinguishable. SVG rendering fills the full browser window, with axis labels styled via D3 selections.
AI-generated descriptionAn example showing the capabilities of VizHub:
- Loads D3 via UNPKG.
- Demonstrates use of
importfrom"d3". - Demonstrates use of
importfrom local ES6 modules.
MIT Licensed





Comments
Sign in to join the discussion.