🌍 Public
Stylized Bar Chart
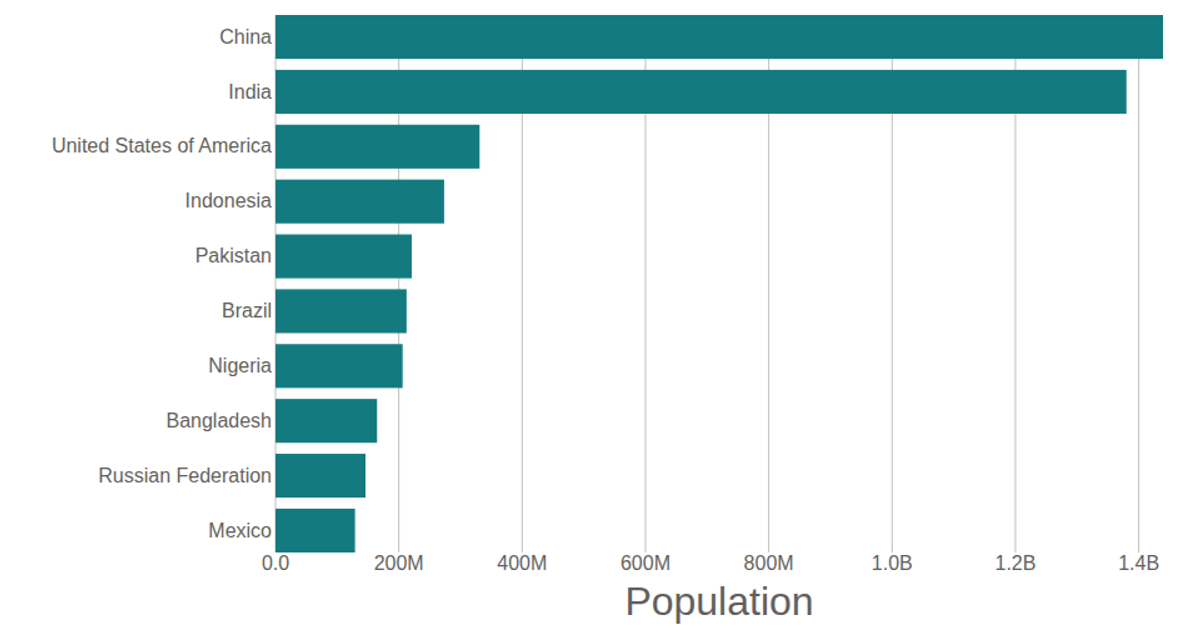
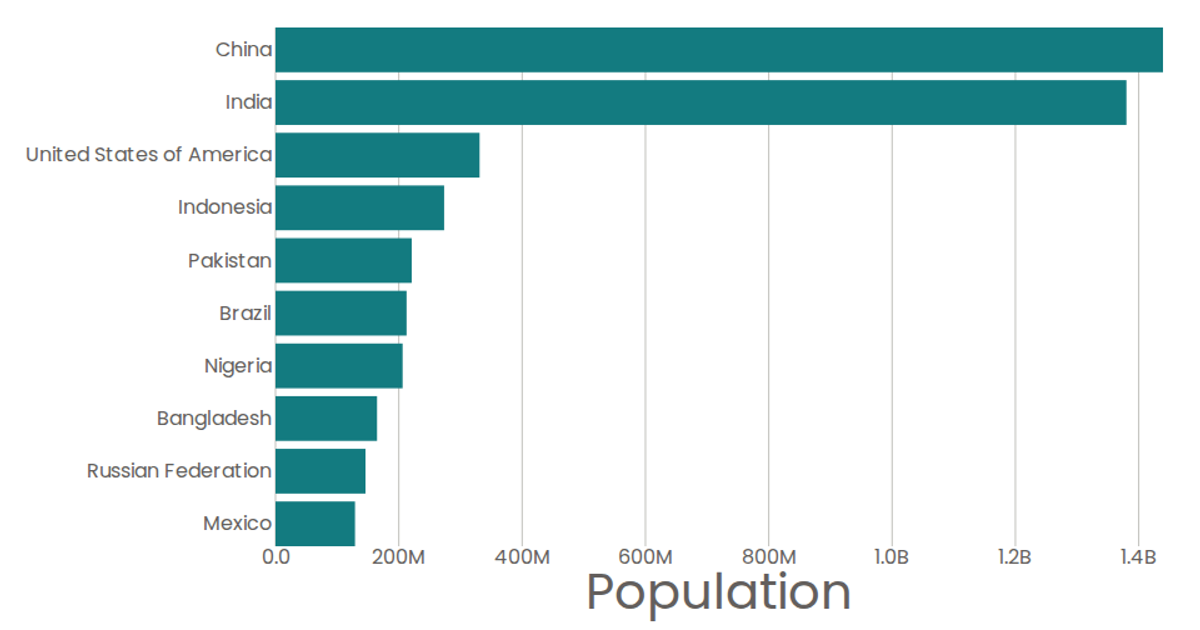
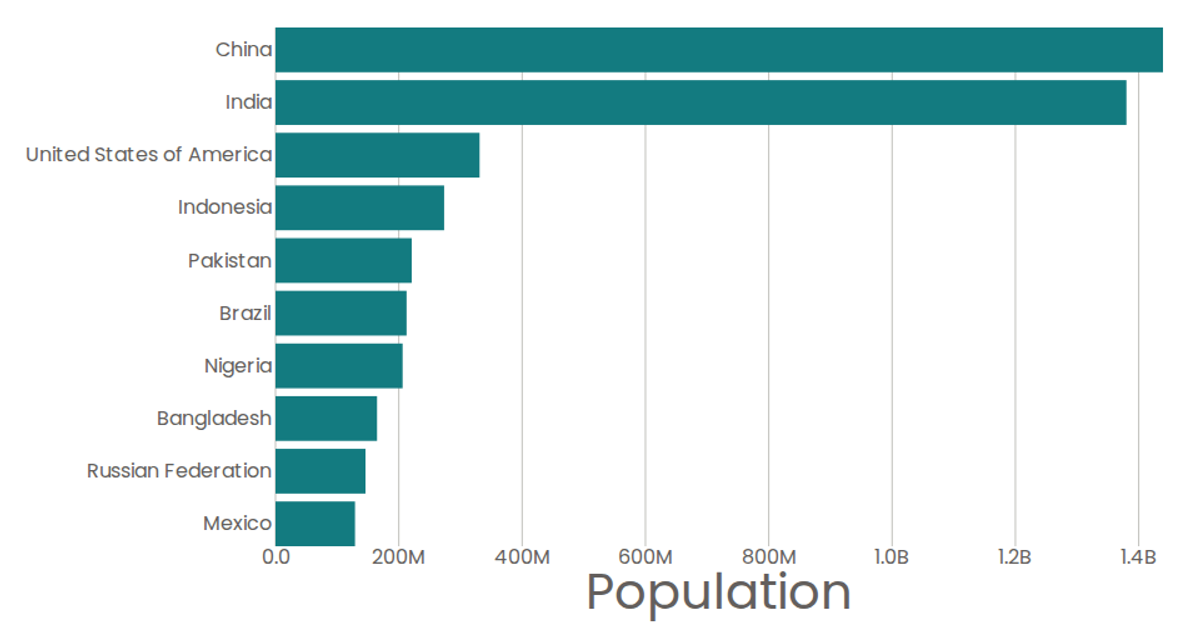
This stylized bar chart displays the top 10 most populous countries using United Nations World Population Prospects 2019 data. The visualization features a horizontal bar layout with labeled axes, where each bar’s length represents population totals. Built with React and D3 v5, it uses `scaleBand` for country positioning, `scaleLinear` for population values, and SVG rendering for the marks. The chart includes a bottom axis with formatted tick labels (converting billions to “B”) and a left axis for country names, with tooltips showing exact population values.
AI-generated descriptionA program that shows the top 10 most populous countries as a pathetic bar chart with no axes.
MIT Licensed



Comments
Sign in to join the discussion.