🌍 Public
Bar Chart
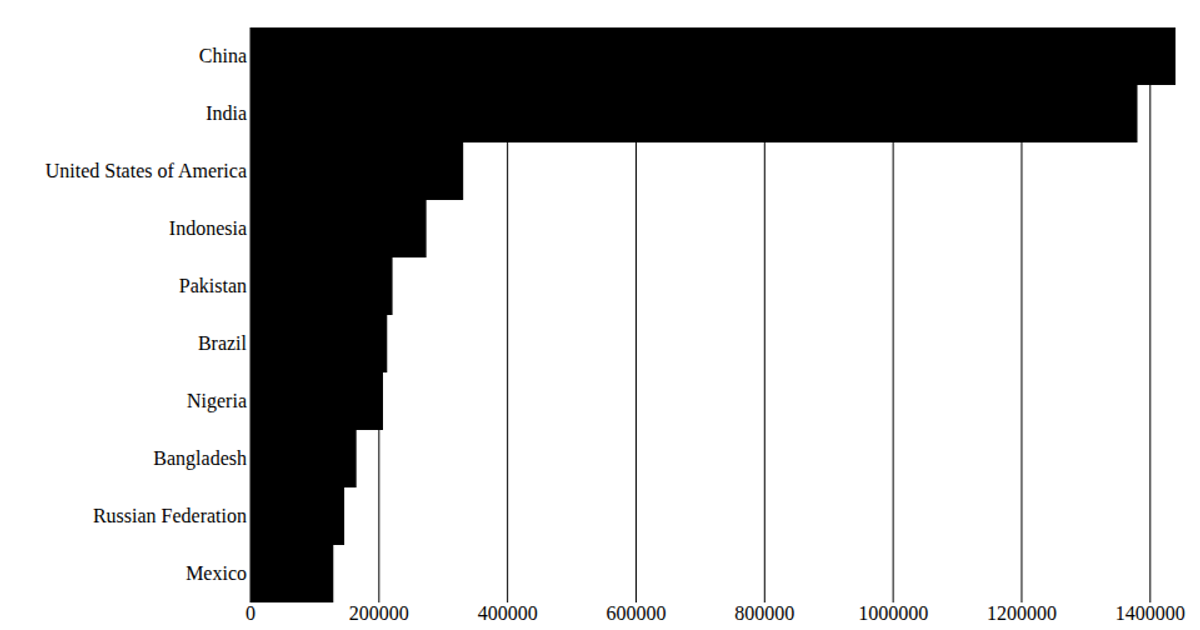
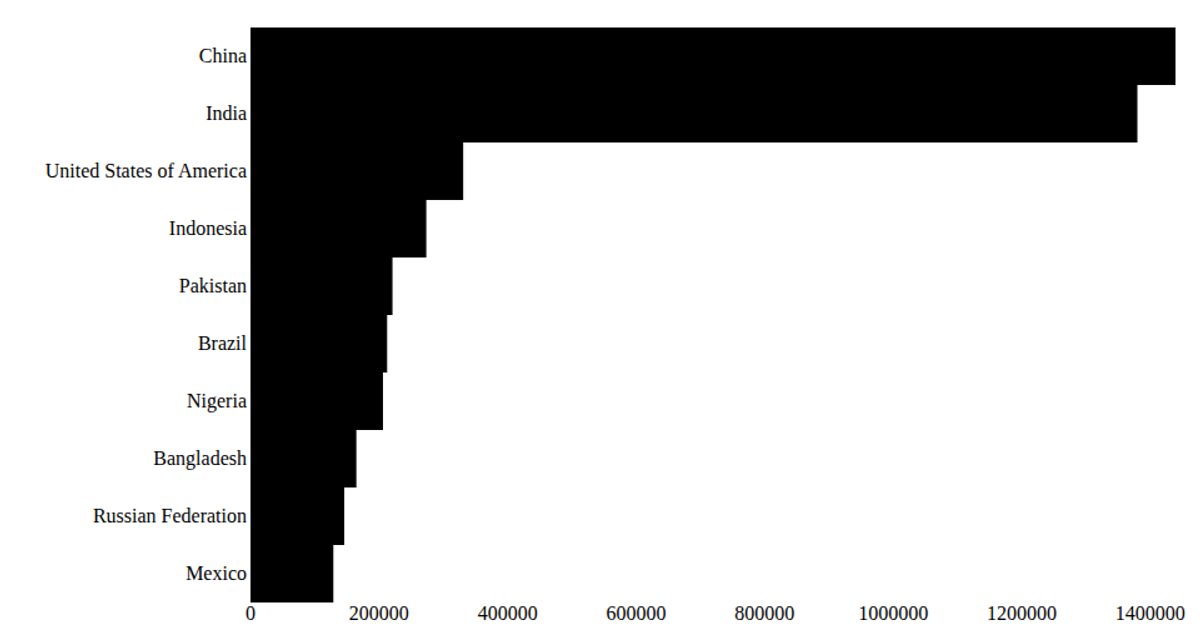
A horizontal bar chart displays the top 10 countries by 2020 population from a UN dataset, loaded via D3’s `csv` and rendered as SVG. The React app uses `scaleBand` for the categorical y-axis and `scaleLinear` for numeric x-axis, with custom `AxisBottom`, `AxisLeft`, and `Marks` components. Population values are formatted in billions using `format('.2s')`, and rectangular marks are colored teal against a minimal grid.
AI-generated descriptionA programme that laods using D3 and using React to keep track
MIT Licensed


Comments
Sign in to join the discussion.