🌍 Public
assn2t5
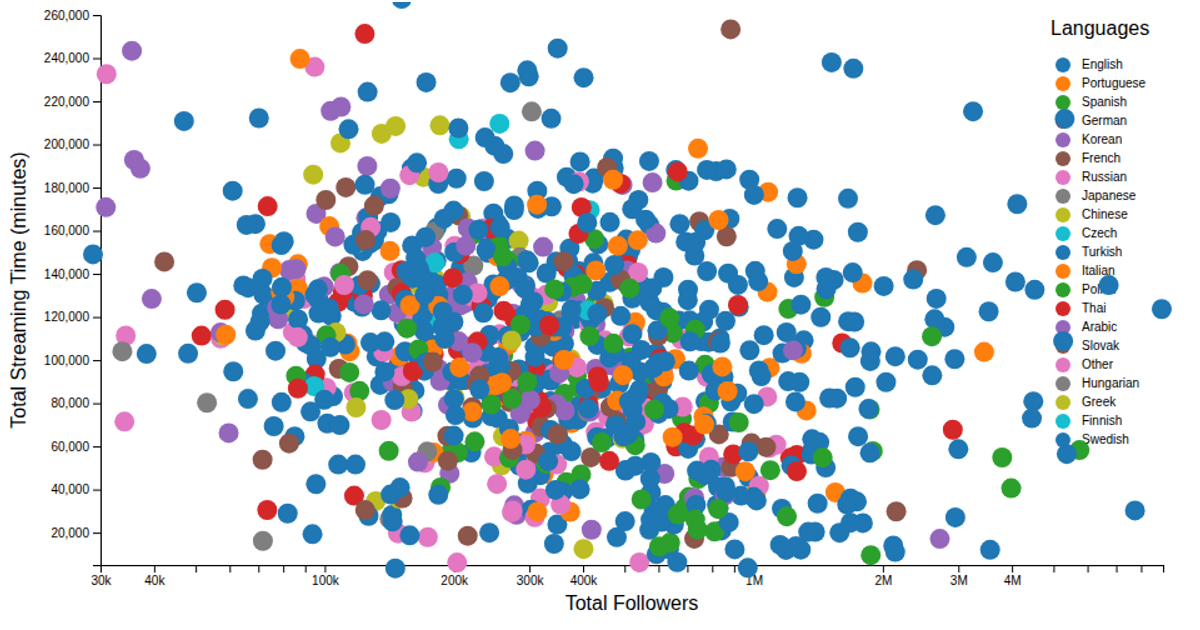
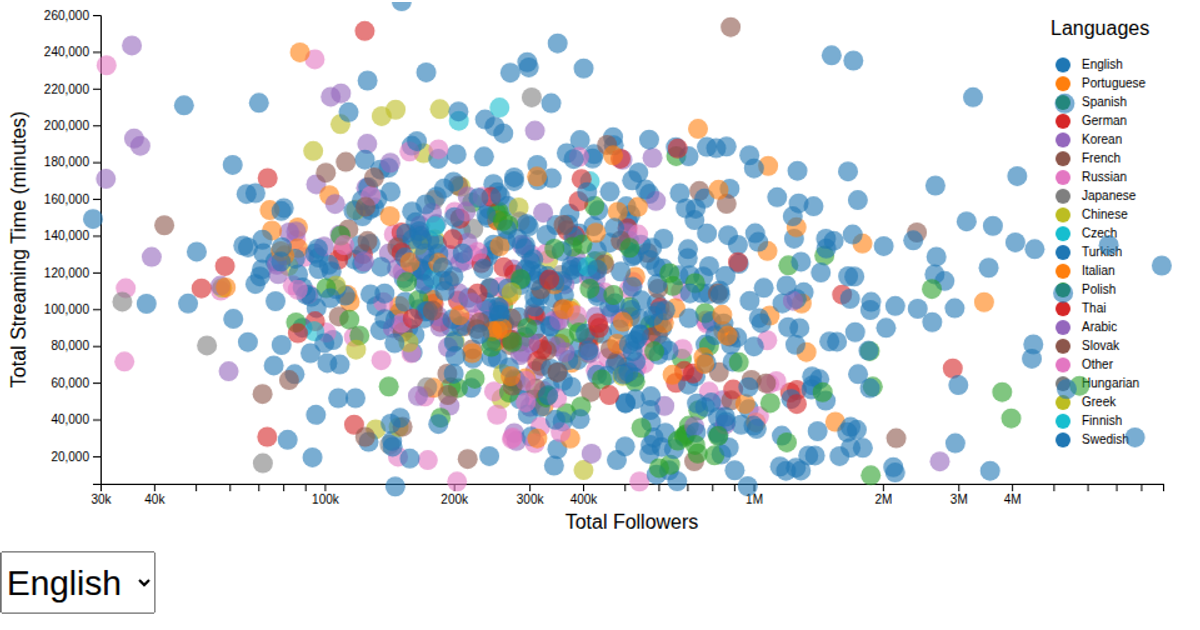
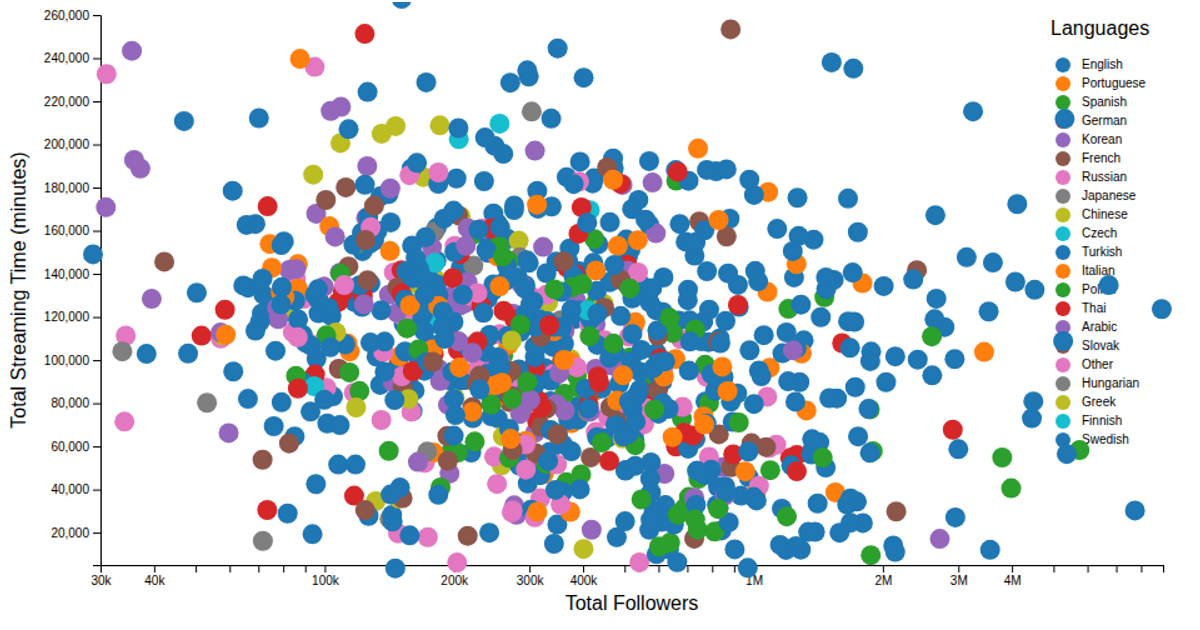
This example shows a scatter plot of Twitch streamers, plotting total followers against total streaming time in minutes, with points colored by language. The chart uses a log scale for the x-axis and a linear scale for the y-axis, and includes a color legend for the language categories. The visualization is built with D3 v7, using `scaleLog`, `scaleLinear`, `scaleOrdinal`, and `schemeCategory10` to map data from a CSV file, with custom reusable modules for axes and color legend rendering.
AI-generated descriptionA demonstration of how to start using D3 version 6.
MIT Licensed




Comments
Sign in to join the discussion.