🌍 Public
ICE-7 Reusable Scatter Plot Anusha
Aanushatod
Last edited Mar 28, 2022
Created on Mar 28, 2022
Forked from ICE - 7 Reusable Scatter Plot Maanas Katta
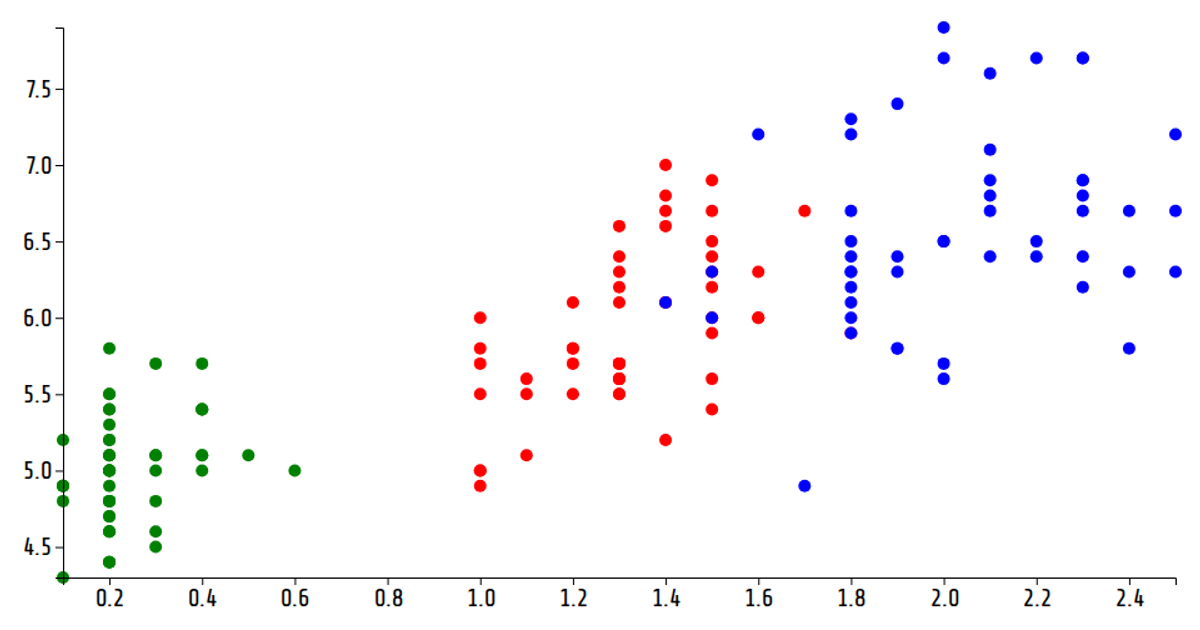
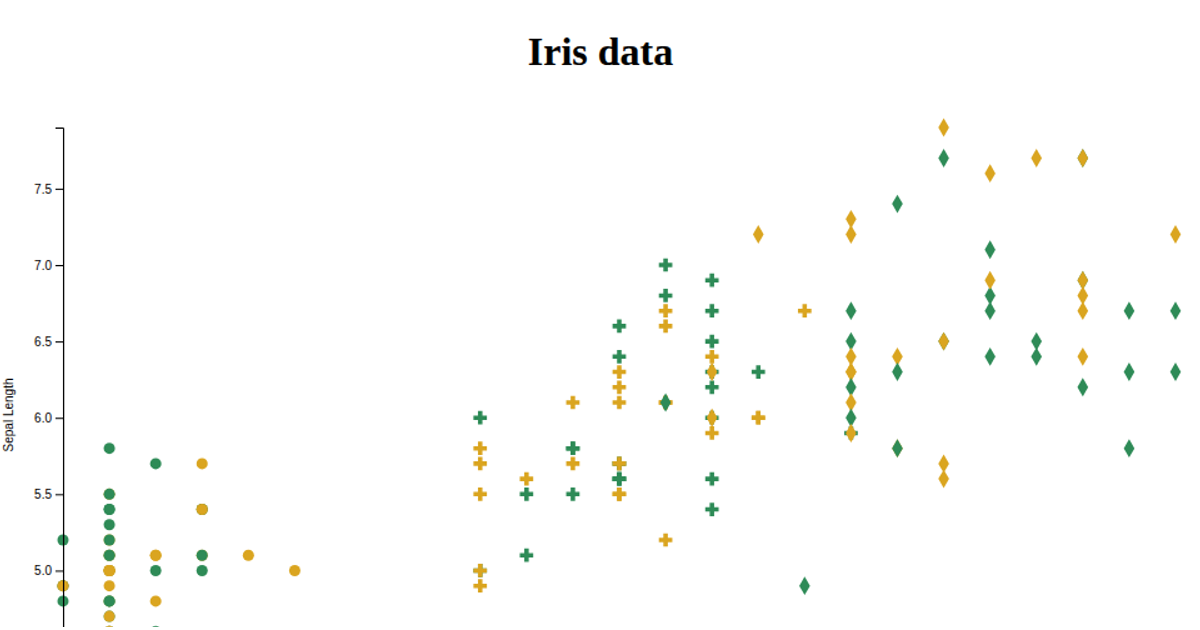
This example shows an animated scatter plot of the Iris dataset, cycling through four different flower measurements (petal width, sepal width, petal length, sepal length) every two seconds. Each point is colored by species: black for setosa, red for versicolor, and purple for virginica. Using D3 v6’s `scaleLinear`, `axisLeft`, `axisBottom`, and a reusable `scatterPlot` function, it updates the x-axis domain and circle positions via `setInterval`. The SVG renders full-screen with a dark background and white axes, loading data from a remote CSV URI.
AI-generated descriptionMIT Licensed






Comments
Sign in to join the discussion.