🌍 Public
Fork of Pie Chart
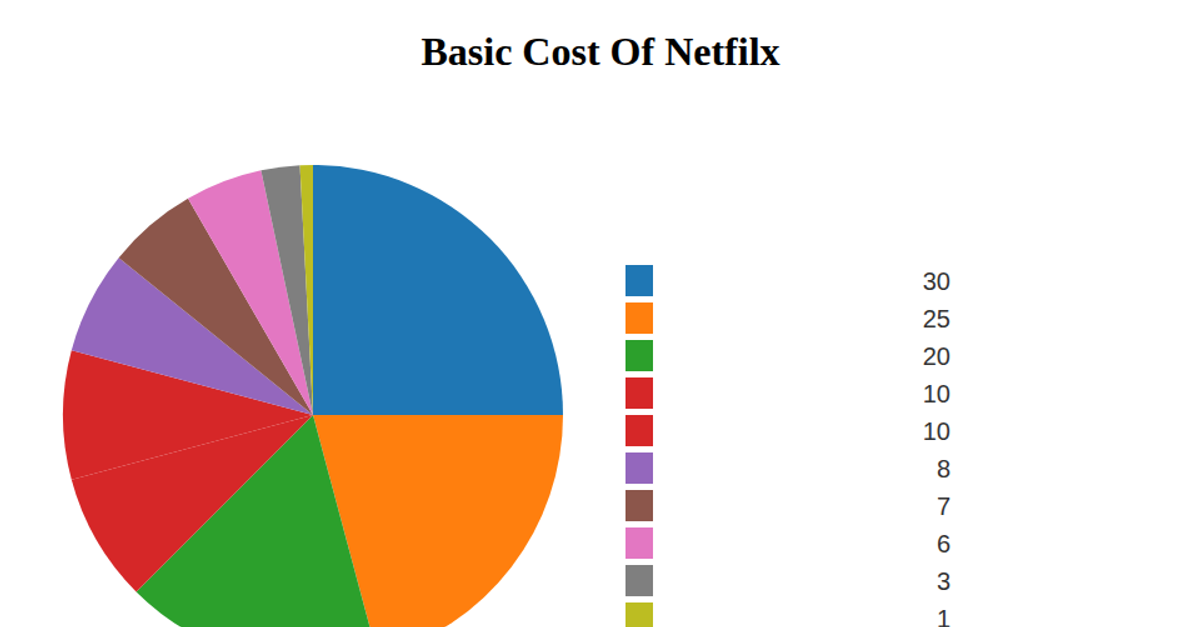
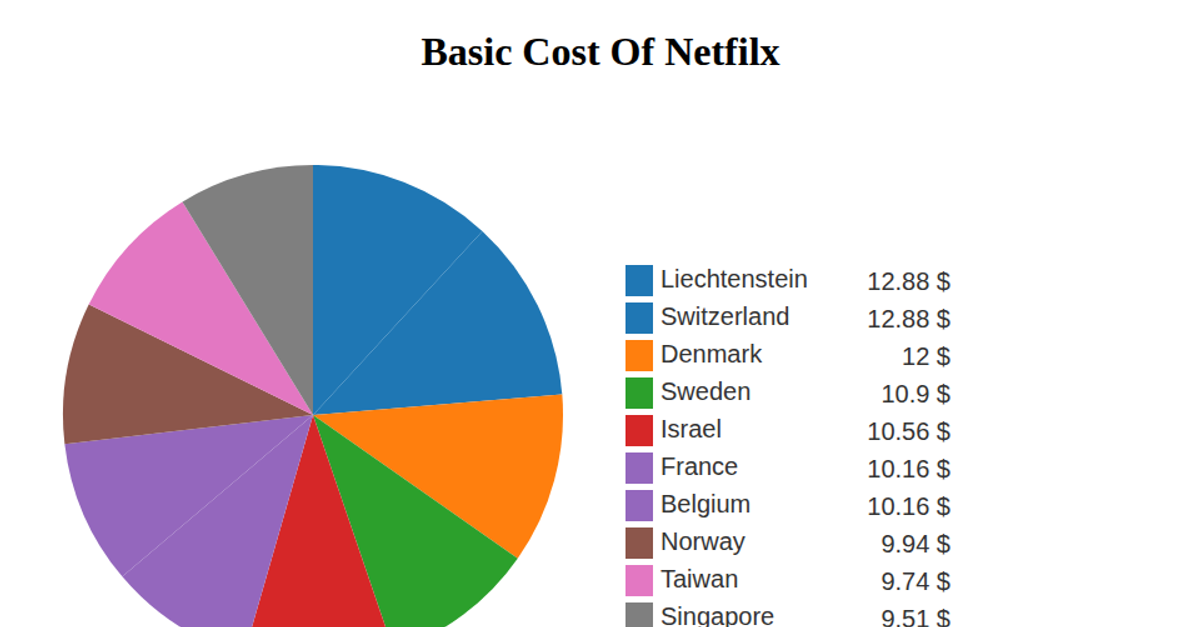
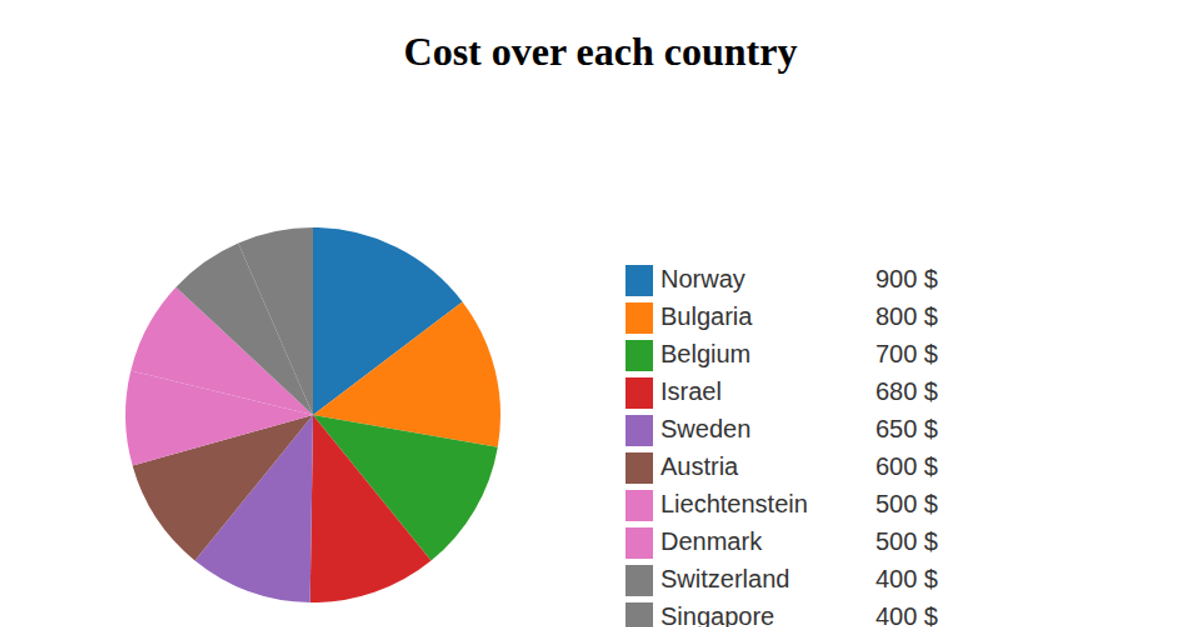
This example displays a pie chart of the basic cost of Netflix for the top eight dog breeds by maximum male weight, using data from a CSV file hosted on GitHub. The chart is rendered as SVG in a React app, with D3 v5 APIs including `d3.pie`, `d3.arc`, `d3.scaleOrdinal`, and `d3.csv`. A legend lists each breed with a color swatch and its associated dollar value, while mouseover events log the breed name to the console. The visualization uses `d3.schemeCategory10` for color encoding.
AI-generated descriptionA bare minimum HTML page demonstrating use of CSS and JavaScript.
See also React Starter.
MIT Licensed




Comments
Sign in to join the discussion.