🌍 Public
Fork of CV: Bar Chart
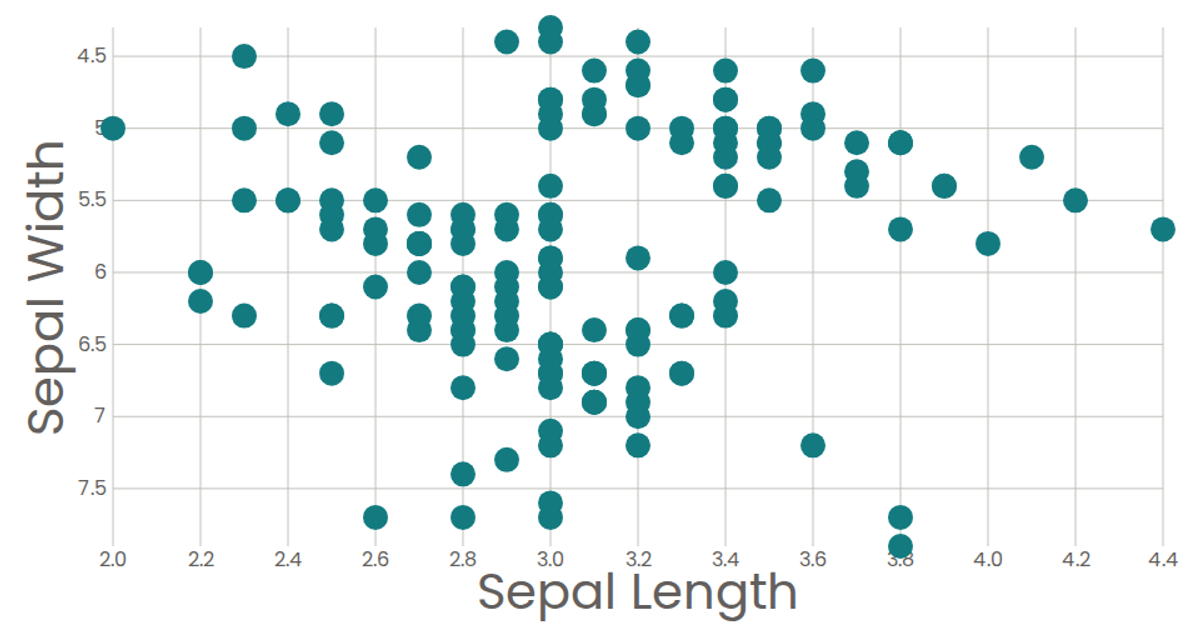
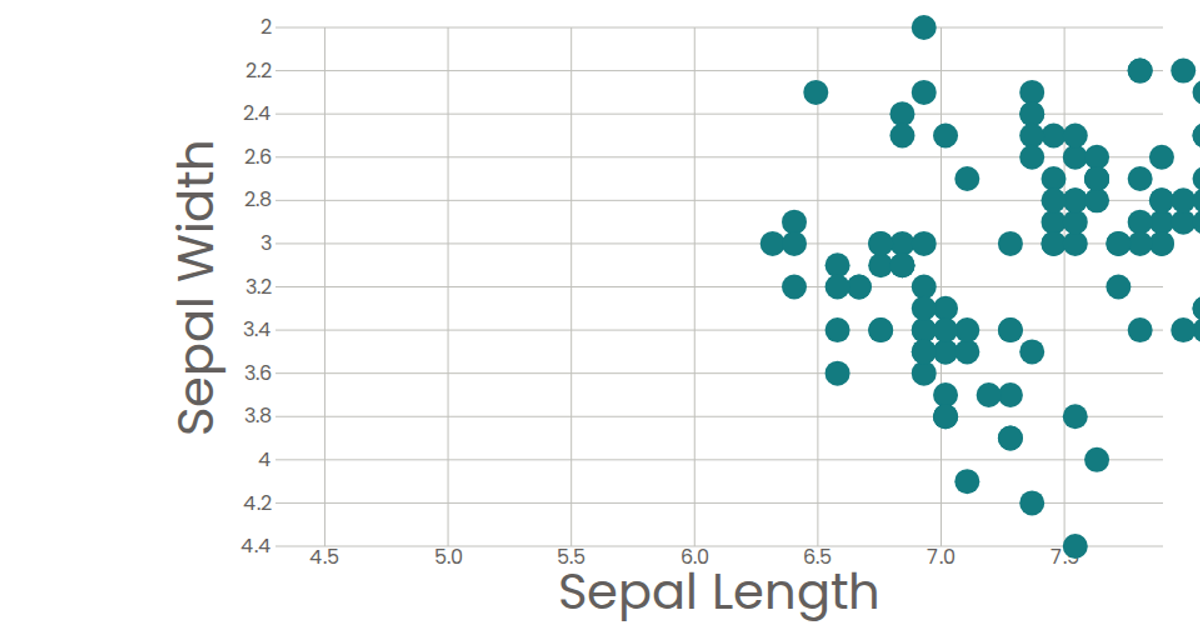
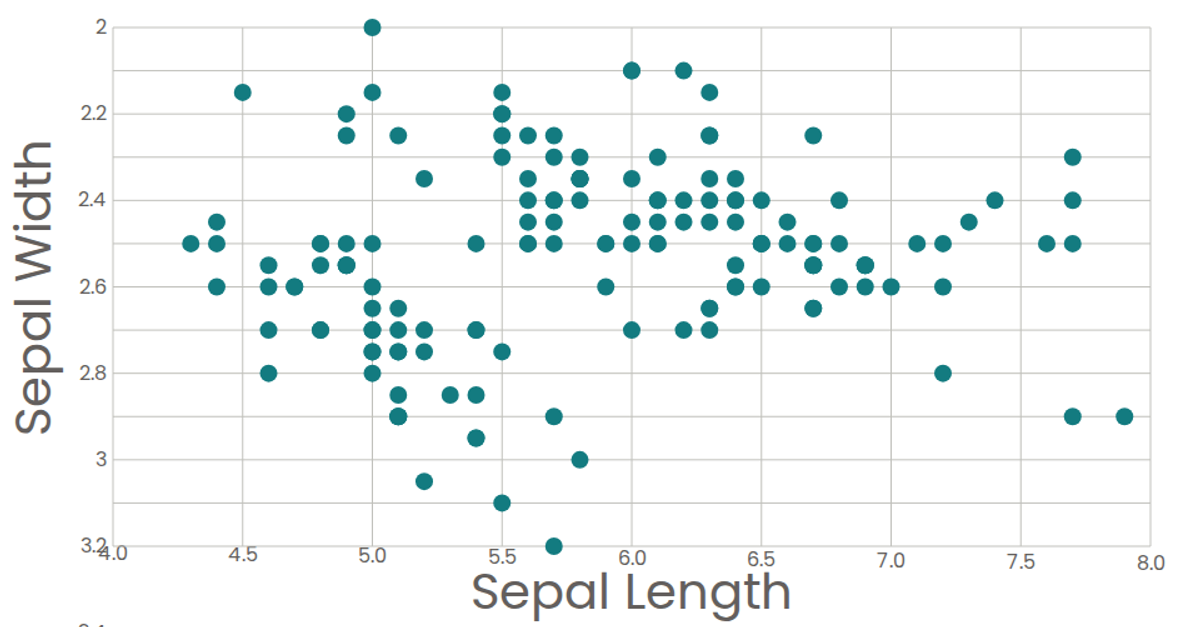
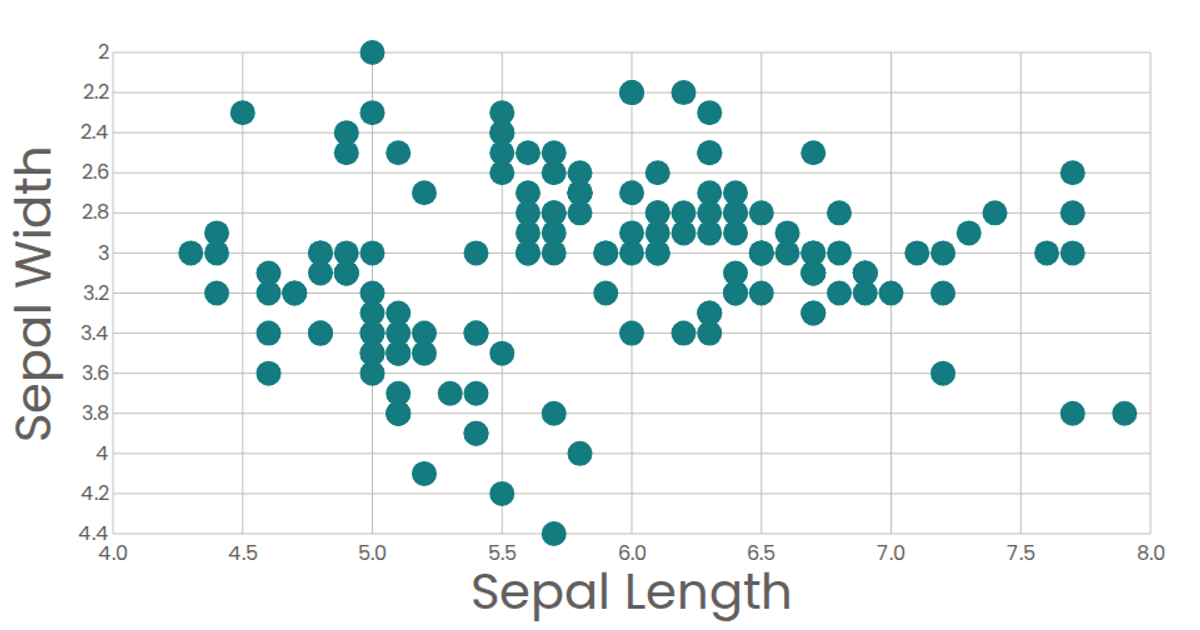
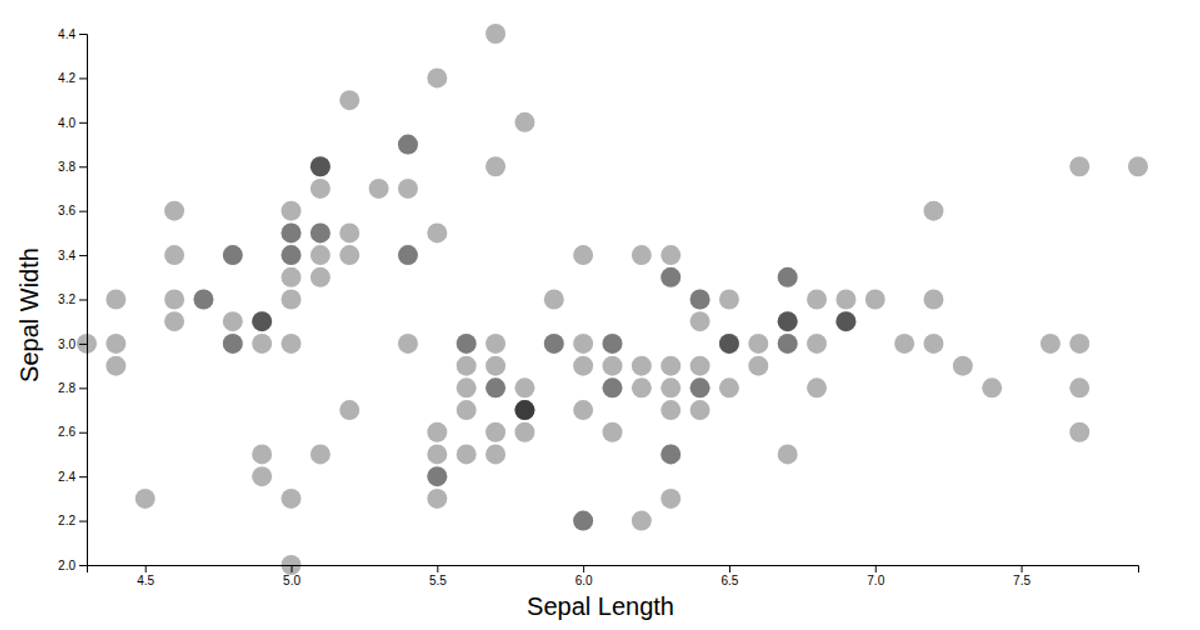
This example visualizes the relationship between stem length and leaf length across a dataset of synthetic orchid measurements, with each dot representing an individual orchid specimen. The visualization is built using React and D3 v7, rendering an SVG scatterplot with teal circles at 70% opacity. The code uses d3.scaleLinear and d3.extent to create the scales, while d3.axisBottom and d3.axisLeft generate the axes. A ResizeObserver hook tracks container dimensions, enabling responsive re-rendering of the chart.
AI-generated descriptionMIT Licensed



Comments
Sign in to join the discussion.