🌍 Public
Melting Data for multiple lines | selecting a Year
Vvladvaculin
Last edited Oct 10, 2019
Created on Sep 10, 2019
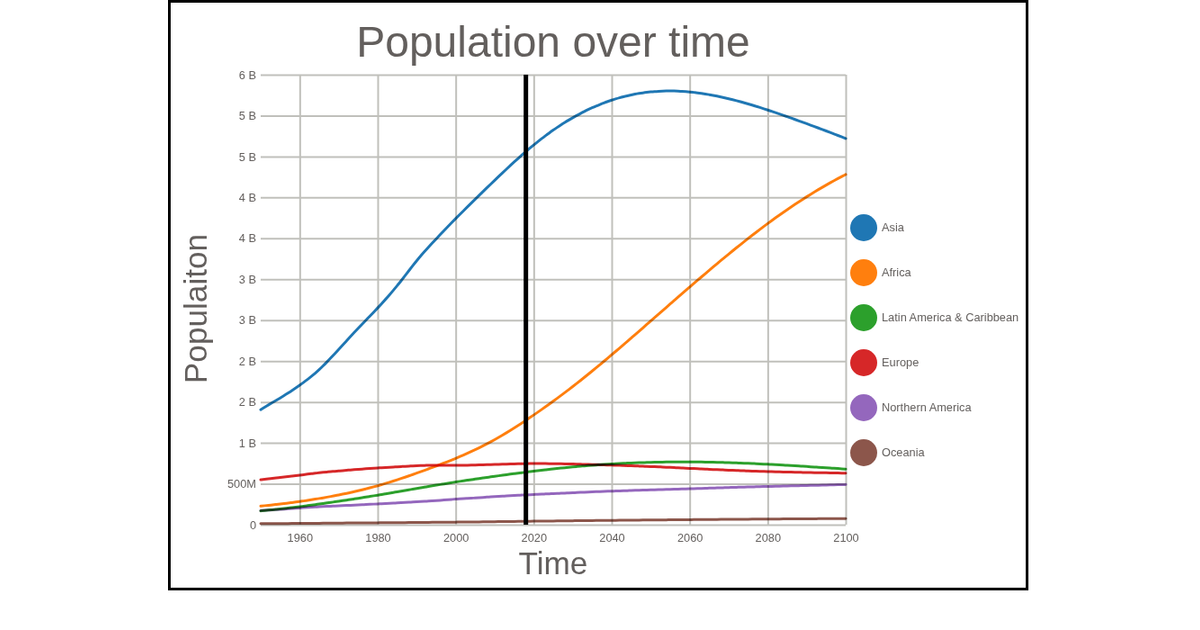
This visualization displays population trends for countries from 1950 to 2100 as multiple smoothed lines, with a vertical line marking the currently selected year. Clicking a legend item or a path isolates that country’s data, while the legend updates to show the population for the chosen year. Built with D3 v5, it uses `d3.nest()`, `d3.line()`, and `curveBasis` to generate paths, with data loaded from UN population estimate CSV files via `d3.dsv()`.
AI-generated descriptionClick on Legend or paths to isolate the data!
MIT Licensed







Comments
Sign in to join the discussion.