🌍 Public
Activity 6_Task 3
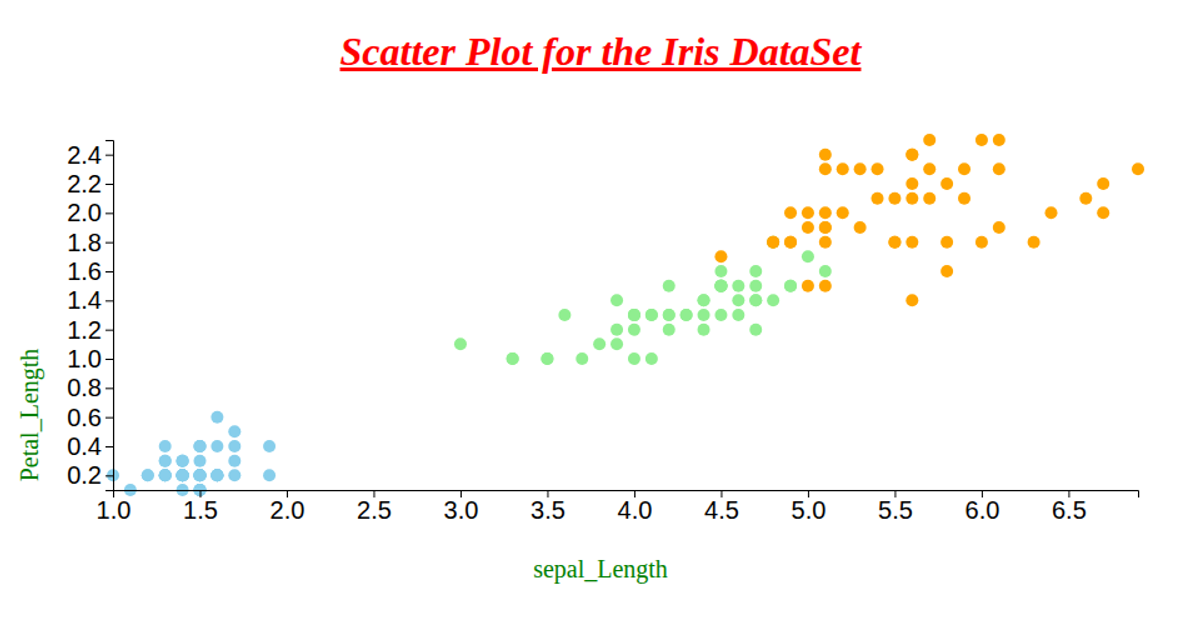
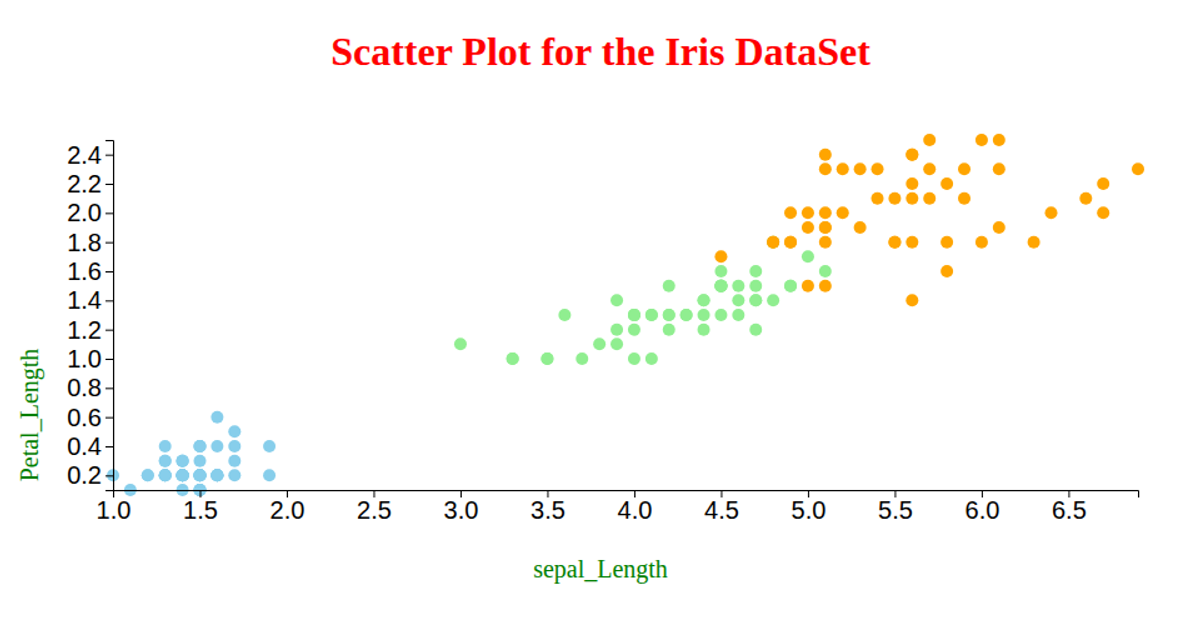
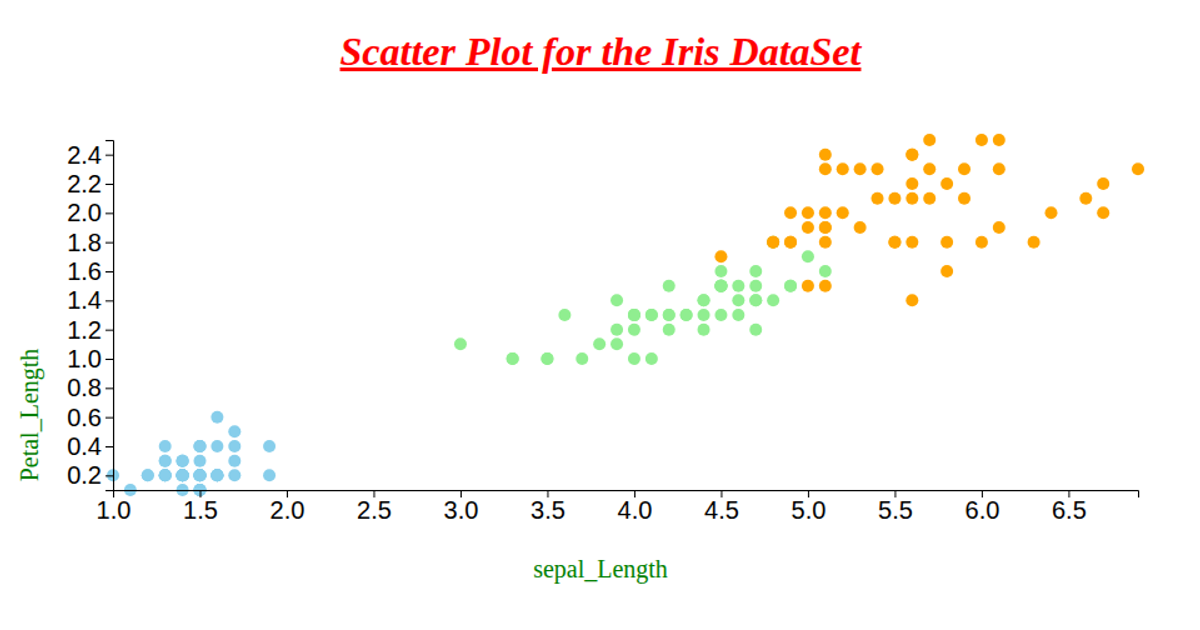
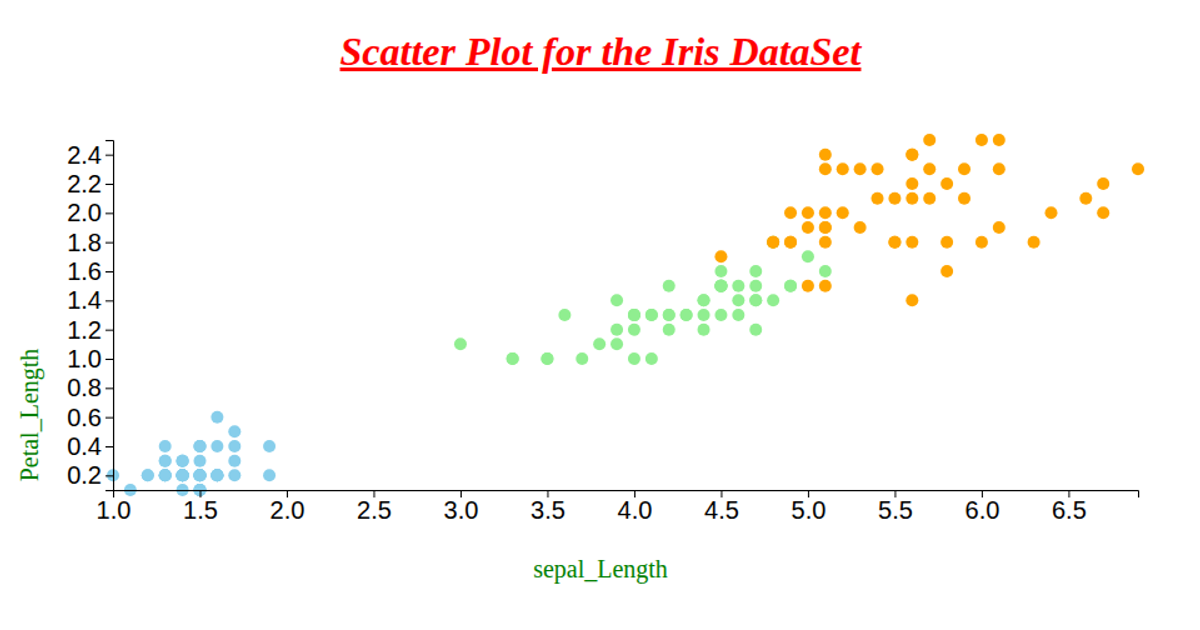
This scatter plot visualizes the Iris dataset, mapping petal length and width on the x and y axes while coloring each point by species (setosa, versicolor, virginica) using a custom color function. Built with D3 v6 and rendered as an SVG, the chart loads CSV data from a remote GitHub URL, uses `scaleLinear` for axes, and applies `axisLeft` and `axisBottom` for tick marks. The legend is implicit through distinct fill colors, with additional attributes like sepal length and width stored but unused in the visual mapping.
AI-generated descriptionWe are Displaying the IRIS dataset using Scatter plot.
MIT Licensed




Comments
Sign in to join the discussion.