🌍 Public
Fork of Missing Migrants Scatter Plot Sashko
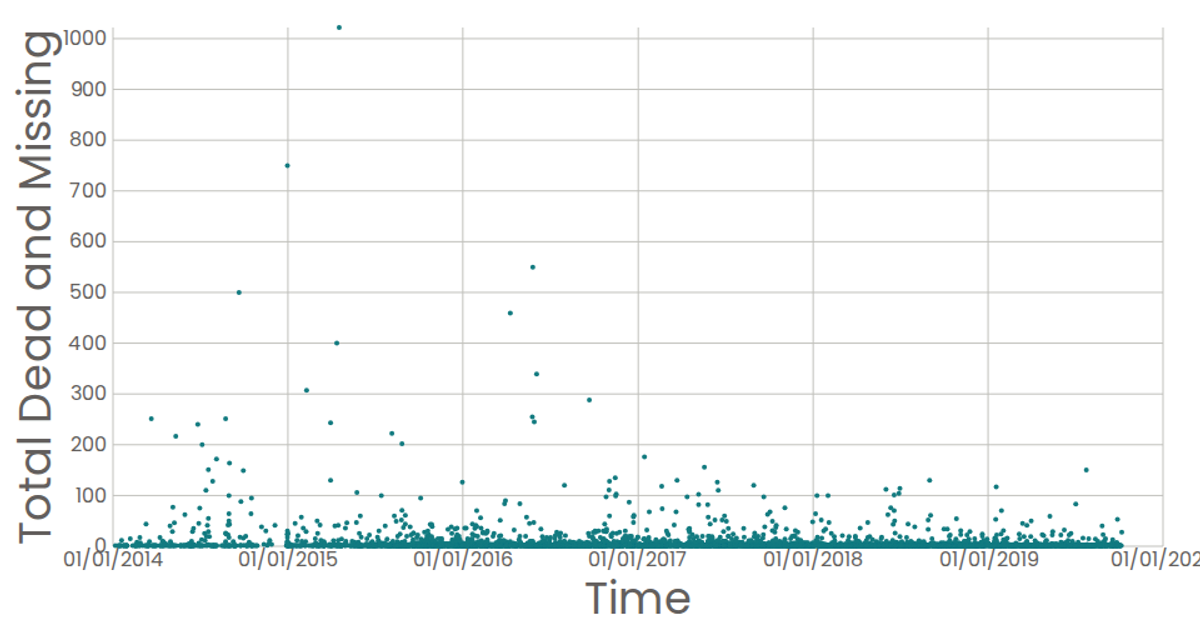
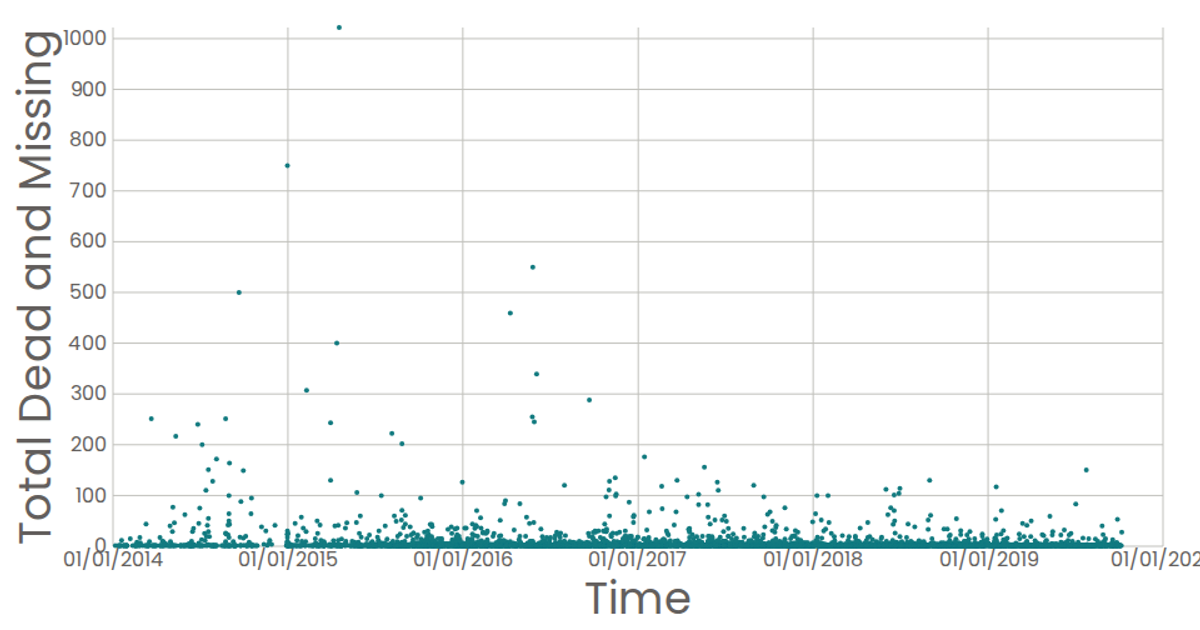
This example visualizes the Missing Migrants Dataset as a scatter plot, where each circle marks a single incident, with the reported date on the x-axis and the total dead and missing on the y-axis. The visualization is built with React and D3 v5, using `scaleTime` and `scaleLinear` for the axes, and `timeFormat` for date tick labels. The SVG marks are rendered via React components, with a Poppins font and custom tick styling, providing a clear view of temporal patterns in migration-related casualties.
AI-generated descriptionA scatter plot of the Missing Migrants Dataset.
Each point in the plot represents a single event.
MIT Licensed




Comments
Sign in to join the discussion.