🌍 Public
5.0 LSS Dashboard
JJonas Carvalho
Last edited Apr 30, 2021
Created on Apr 9, 2021
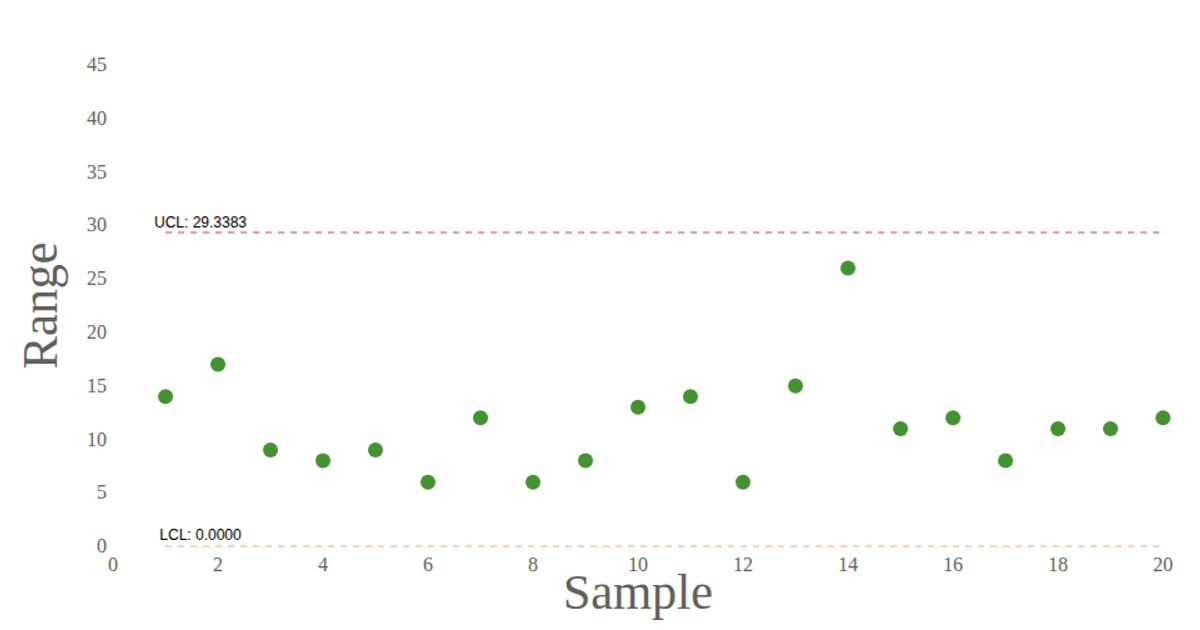
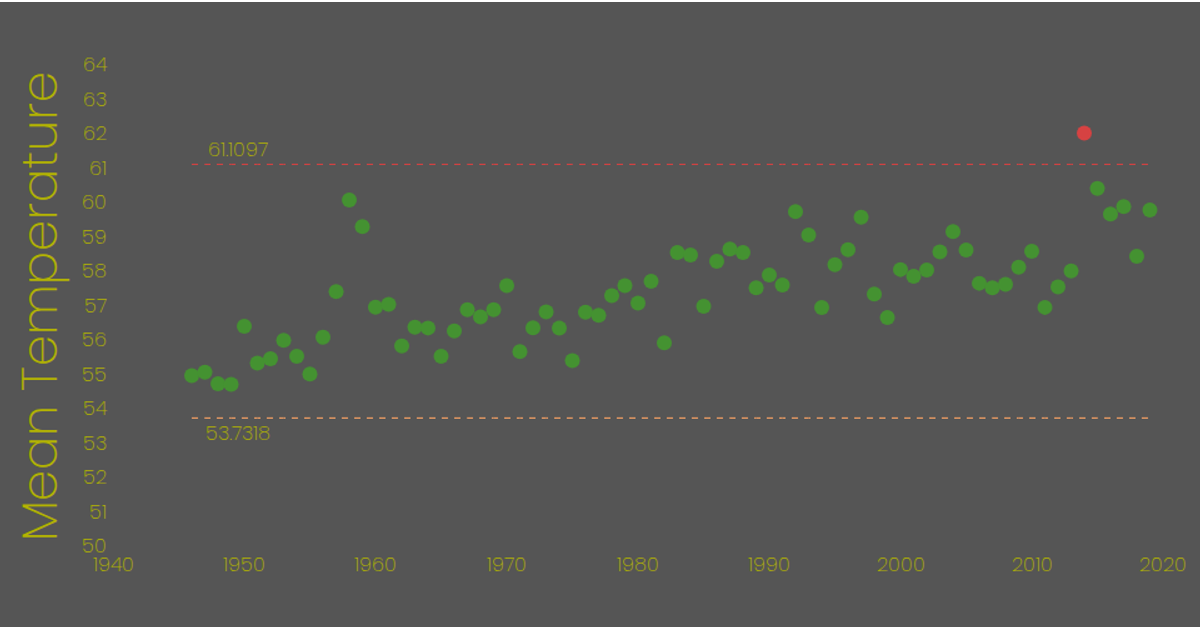
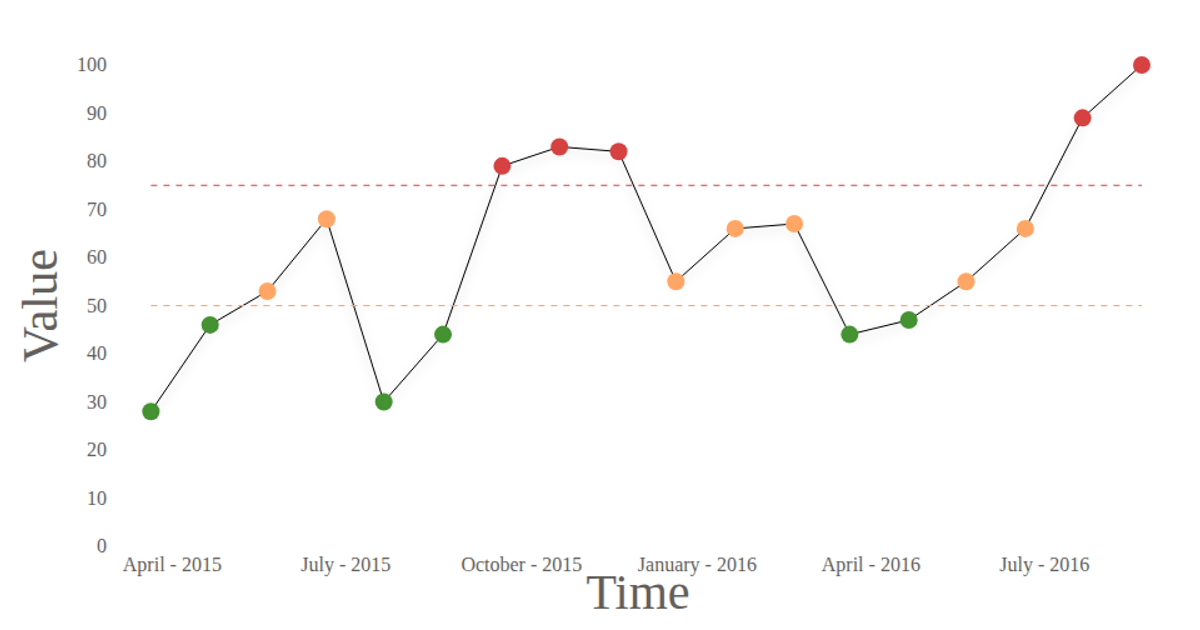
This dashboard compares a control chart with a capability analysis histogram to assess process stability. The left panel displays a line chart of the selected phase, including the average and control limits, with special cause rules highlighting out-of-control points in red. The right panel shows a histogram with an overlaid normal distribution, depicting short-term (ST) and long-term (LT) process capability lines. Users adjust the mean and standard deviation via sliders, which recalculates the data. The visualization uses React for components and D3 (v6) for SVG, scales, axes, and rendering.
AI-generated descriptionLoading data with d3 and using react
MIT Licensed




Comments
Sign in to join the discussion.