🌍 Public
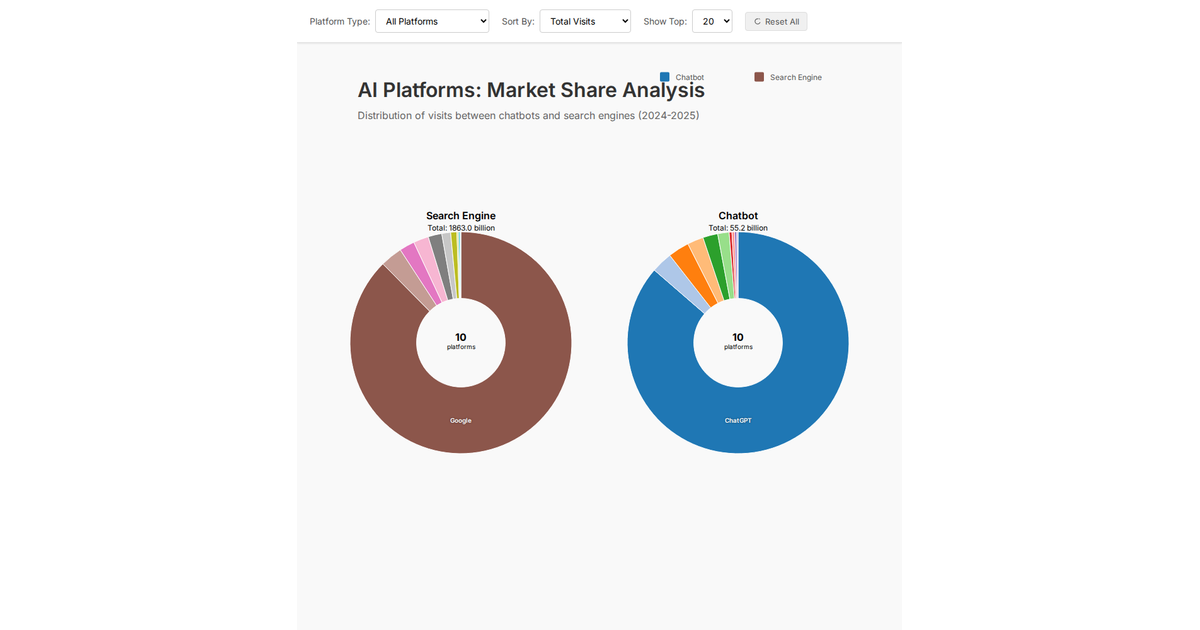
Fork of https://www.voronoiapp.com/technology/AI-Chatbots-vs-Search-Engines-Who-is-Winning-the-Traffic-War-4952
NNita
Last edited May 6, 2025
Created on May 6, 2025
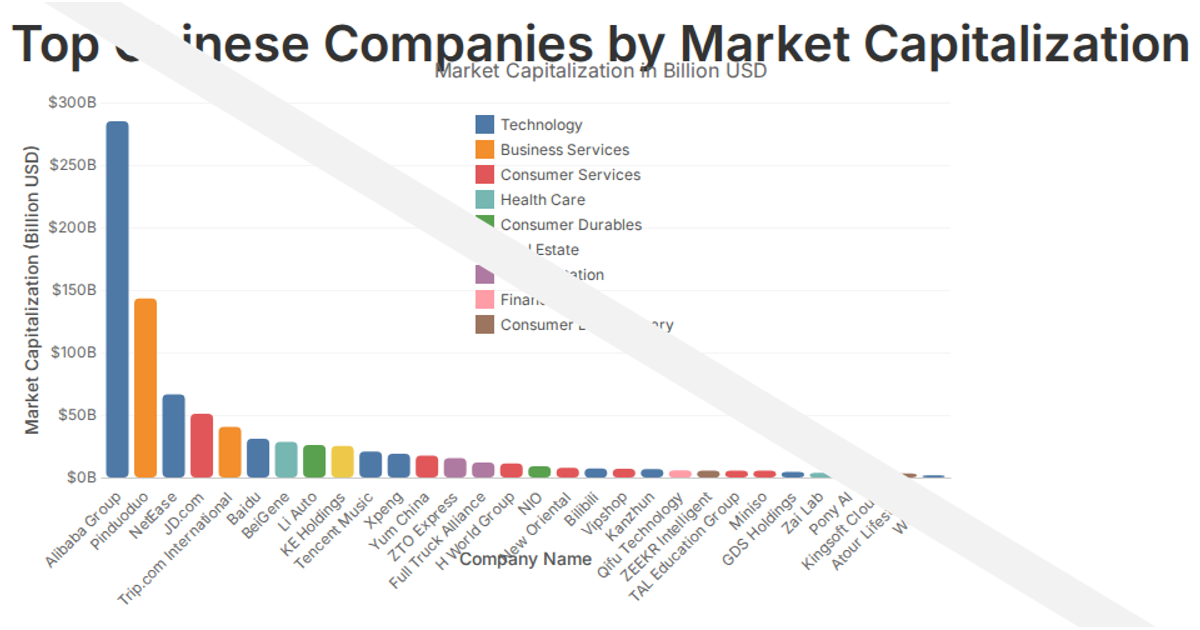
This interactive donut chart visualizes the distribution of top Chinese companies by market capitalization across sectors. Slices represent aggregated sector values, with hover effects enlarging slices and displaying tooltips showing market cap and percentage share. Clicking a slice or legend item filters the data to that sector, while a summary panel displays top companies or sector details. Built with React and D3 v7, it uses `d3.pie`, `d3.arc`, `d3.scaleOrdinal`, and D3's `join` operator for SVG generation, with data loaded from CSV.
AI-generated descriptionMIT Licensed





Comments
Sign in to join the discussion.