🌍 Public
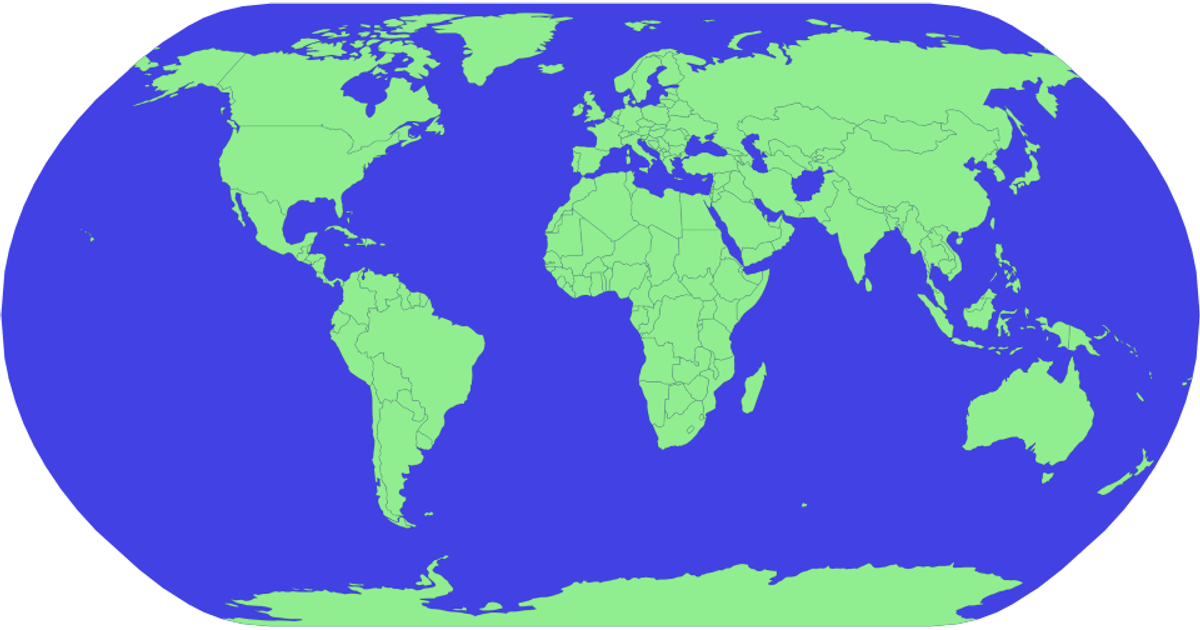
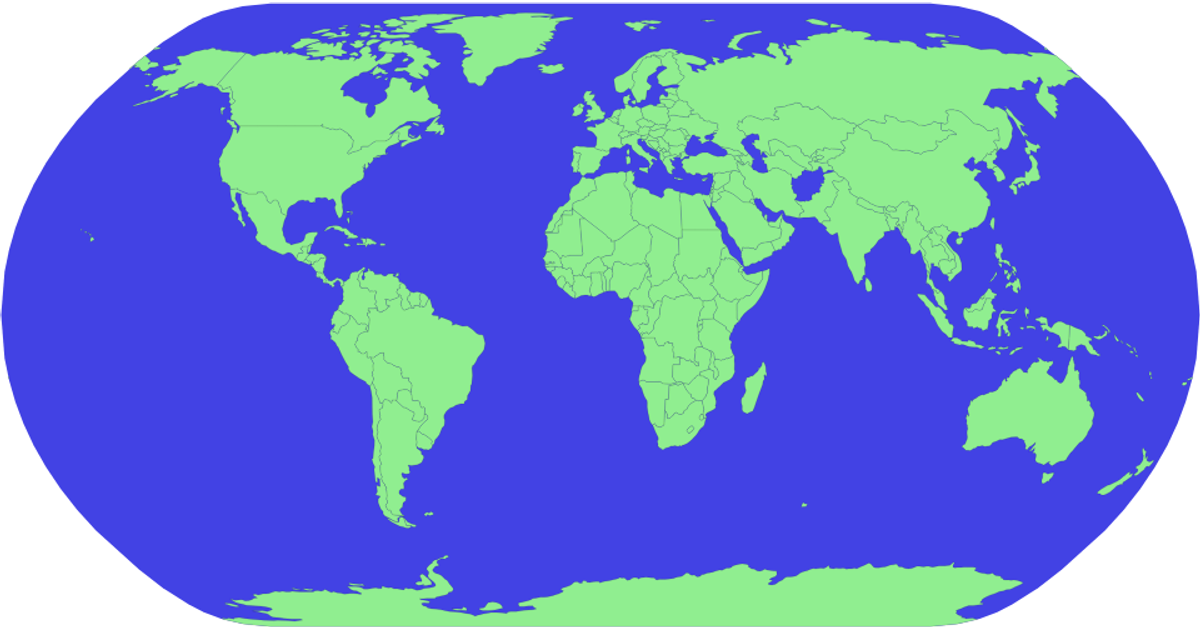
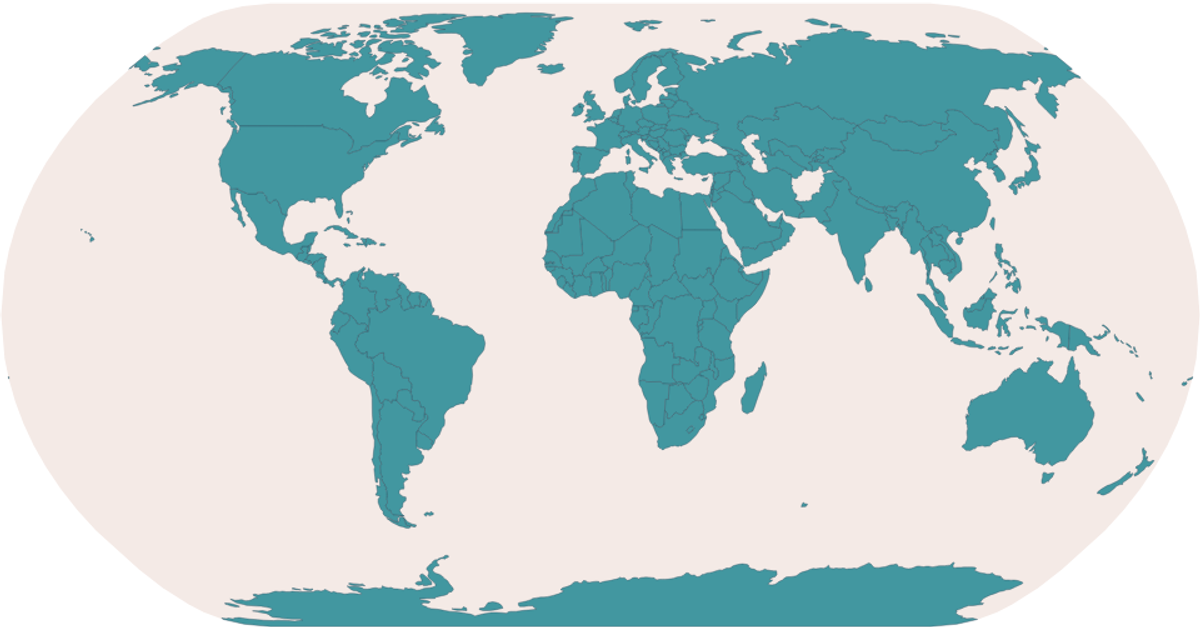
Let's make a world map with D3.js!
A simple world map renders countries as filled brown shapes on a blue ocean sphere, using D3.js v5 with a Natural Earth projection from `d3.geoNaturalEarth1`. The SVG paths are generated by `d3.geoPath` and features are extracted from a TopoJSON dataset (world-atlas countries-110m) via topojson's `feature` function. Countries are styled in CSS, with ocean fill applied to the initial sphere path.
AI-generated descriptionMIT Licensed




Comments
Sign in to join the discussion.