Apple Quality Dataset
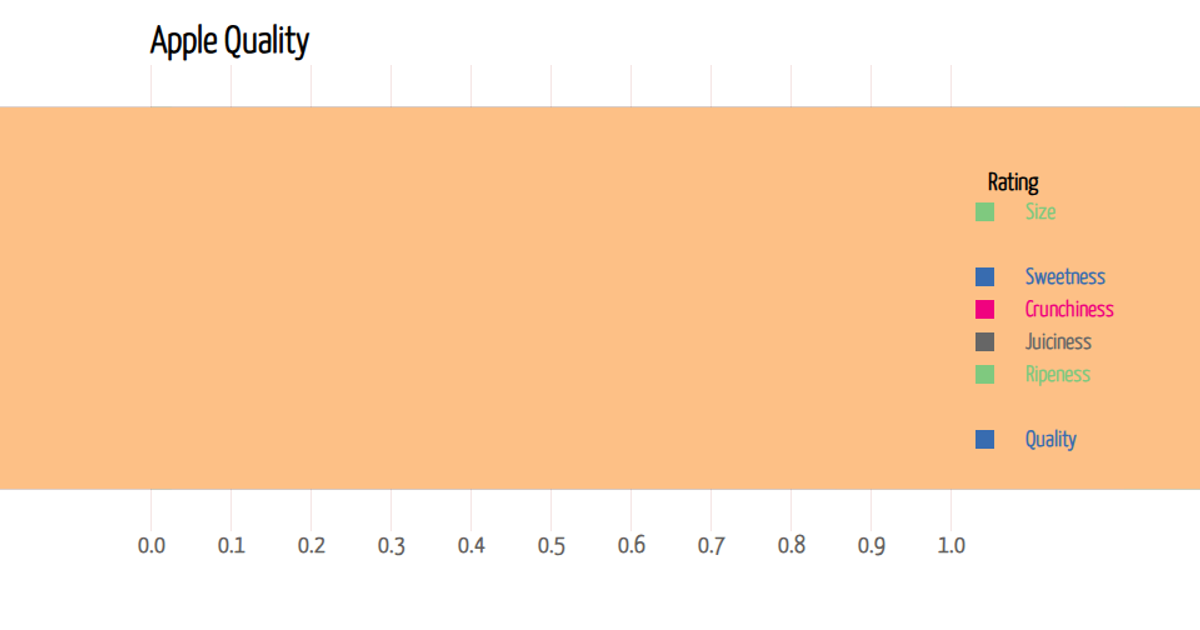
This visualization displays the first row of the Apple Quality dataset, which contains seven numerical attributes—Size, Weight, Sweetness, Crunchiness, Juiciness, Ripeness, and Acidity—along with a quality label of either "good" or "bad." The code loads the data from a CSV file, converts each attribute to a number, and renders the first data point as a JSON object in a large monospaced font. The example uses the standard JavaScript `JSON.stringify` method within a container element to present the raw data structure.
AI-generated descriptionhttps://www.kaggle.com/datasets/nelgiriyewithana/apple-quality?select=apple_quality.csv
https://github.com/lukesavoie/dataviz/blob/main/apple_quality.csv?plain=1 loaded and parsed as CSV.
Questions: Most important qualities for a good apple. What makes a bad apple. Average values for good and bad apples separately and compare.




Comments
Sign in to join the discussion.