🌍 Public
combined chart
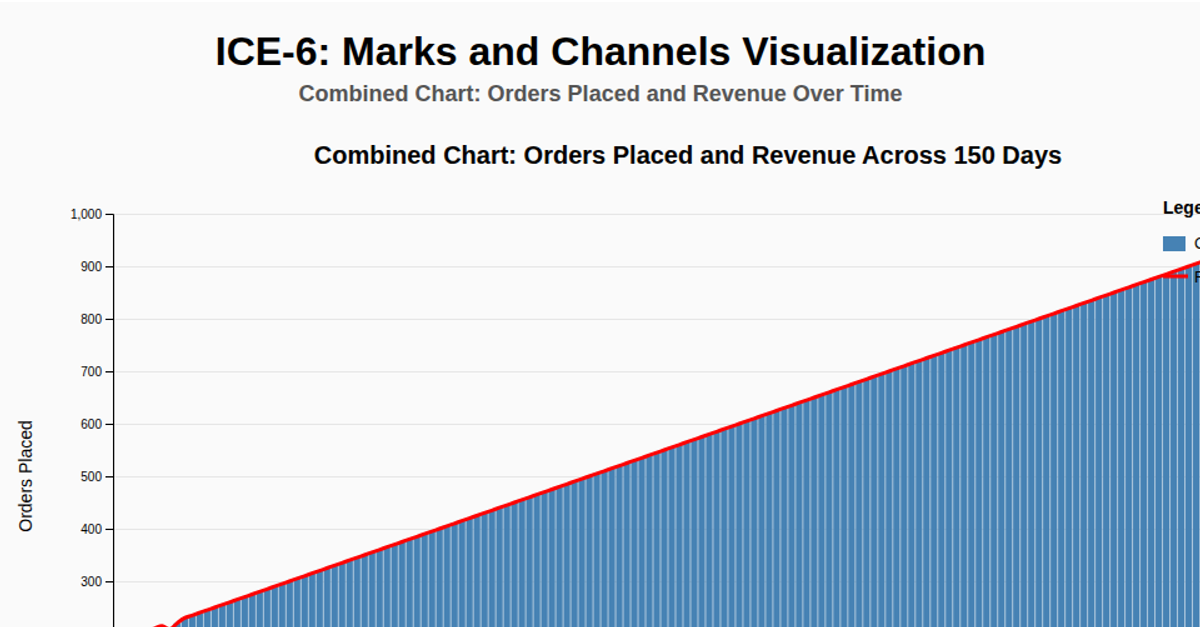
This combined chart displays the relationship between daily orders placed and revenue in US dollars for an e-commerce website, using the first 40 days of a CSV dataset. Steel-blue bars represent order counts on the left y-axis, while a red Catmull-Rom smoothed line shows revenue on the right y-axis. Built with D3 v7, the visualization uses `d3.scaleBand`, `d3.scaleLinear`, `d3.axisLeft`, `d3.axisRight`, and `d3.line` to render the SVG elements, complete with gridlines, labels, and a legend. Data is fetched and parsed via `d3.text` and `d3.csvParse`.
AI-generated descriptionMIT Licensed



Comments
Sign in to join the discussion.