🌍 Public
Final Project Import/Export Bar Graph
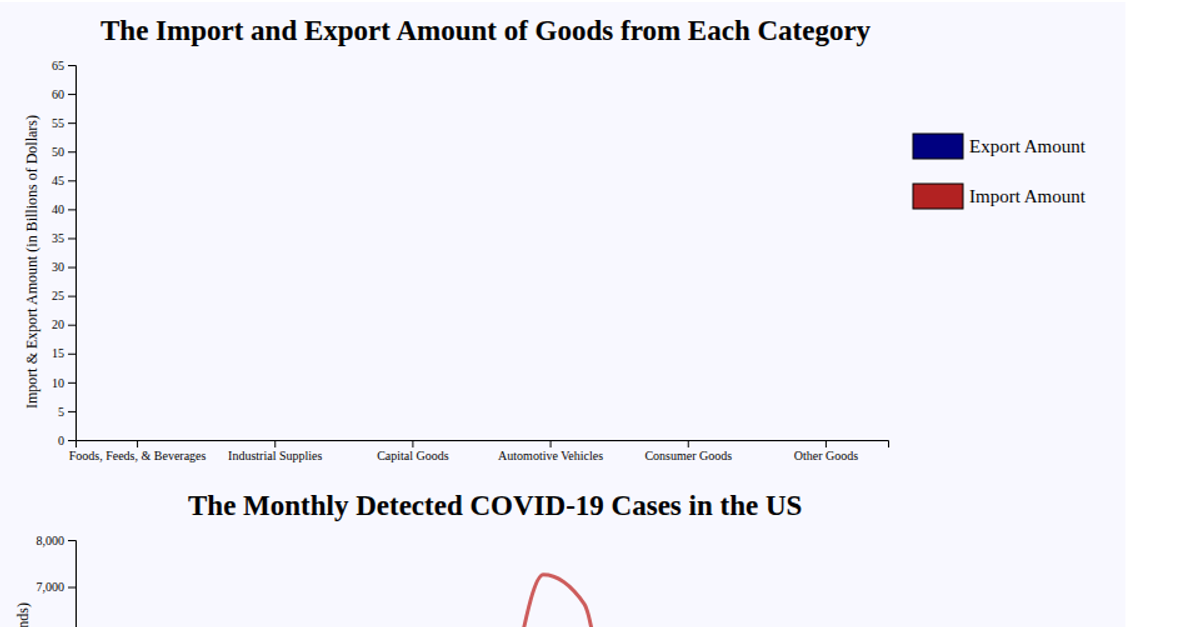
This chart displays U.S. grain exports and imports for the year 2023, with horizontal bars for each grain type plotted side-by-side against separate linear scales for exports and imports. Built with D3 v6 and rendered as SVG, it uses `d3.csv` to load annual data from two remote CSV files, `d3.scaleBand` for the categorical axis, and `d3.scaleLinear` for the quantitative values. D3 legend and topojson libraries are also included, though the legend is not visibly used in the final rendering.
AI-generated descriptionMIT Licensed





Comments
Sign in to join the discussion.