🌍 Public
Fork of Dinosaur D3 Scatter Plot
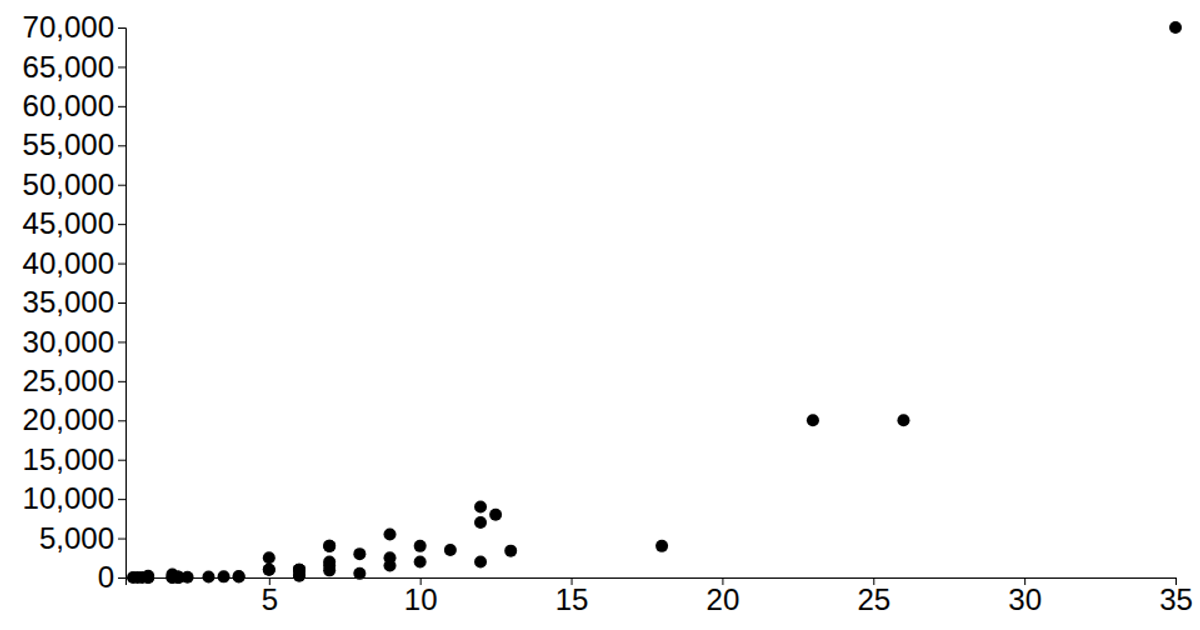
A scatterplot of dinosaur length versus weight, plotted with D3 scales and axes. Each point is a circle positioned by `d3.scaleLinear` domains, with an SVG `<title>` tooltip revealing the genus, period, diet type, length, and weight on hover. Data comes from a JSON dataset via `d3.json`, parsed with a custom row-accessor, and rendered using SVG circles and `d3.axisLeft`/`d3.axisBottom`. Values are formatted with `d3.format` for comma-separated weight labels.
AI-generated descriptionA scatterplot of the length (x-axis) vs. the weight (y-axis) of dinosaurs.
Hover over each plot for further details about the dinosaur.
Uses the Dinosaur Directory Dataset, courtesy of the Natural History Museum, London (nhm.ac.uk)
MIT Licensed




Comments
Sign in to join the discussion.