🌍 Public
CSCE 5320 HW6 - Rules of Thumb
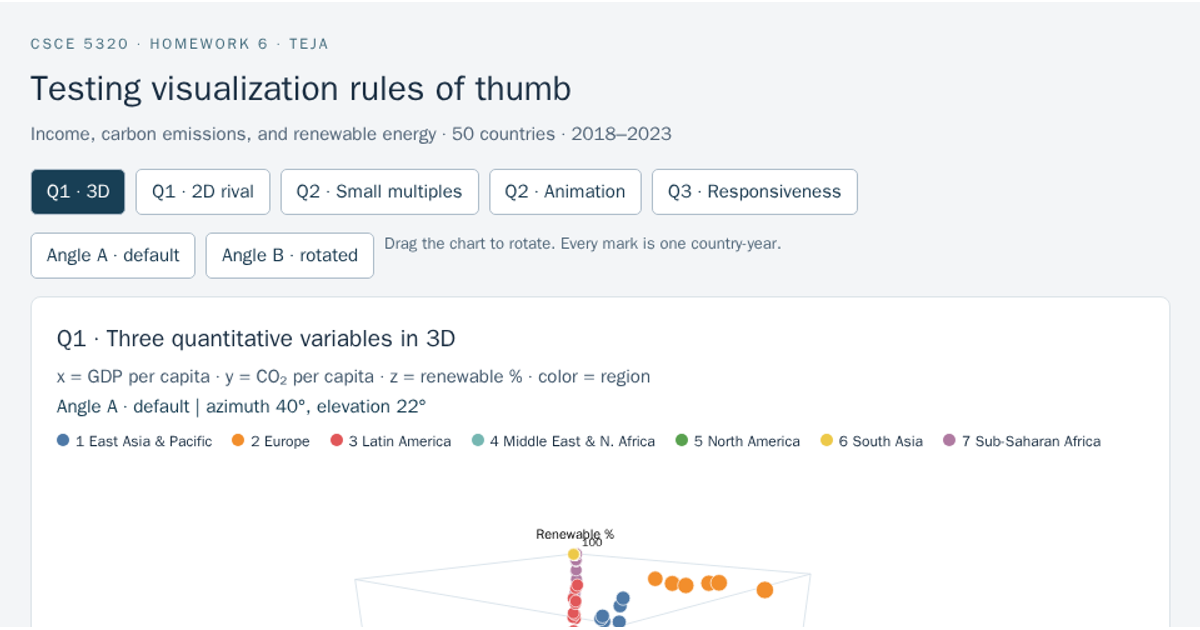
This interactive D3 visualization tests the “rules of thumb” for scatterplot design using Gapminder data on GDP per capita, life expectancy, and population from 1982–2007. Users can load data via URL or file, then compare different chart types—SVG-based with animation, WebGL, and a Plotly 3D view—to see how mark size, color, and layout affect perceptibility. The interface includes brushing, selection, and hover tooltips via d3.pointer, with performance timers displayed for each rendering method.
AI-generated descriptionMIT Licensed


Comments
Sign in to join the discussion.