🌍 Public
Project and Activity List
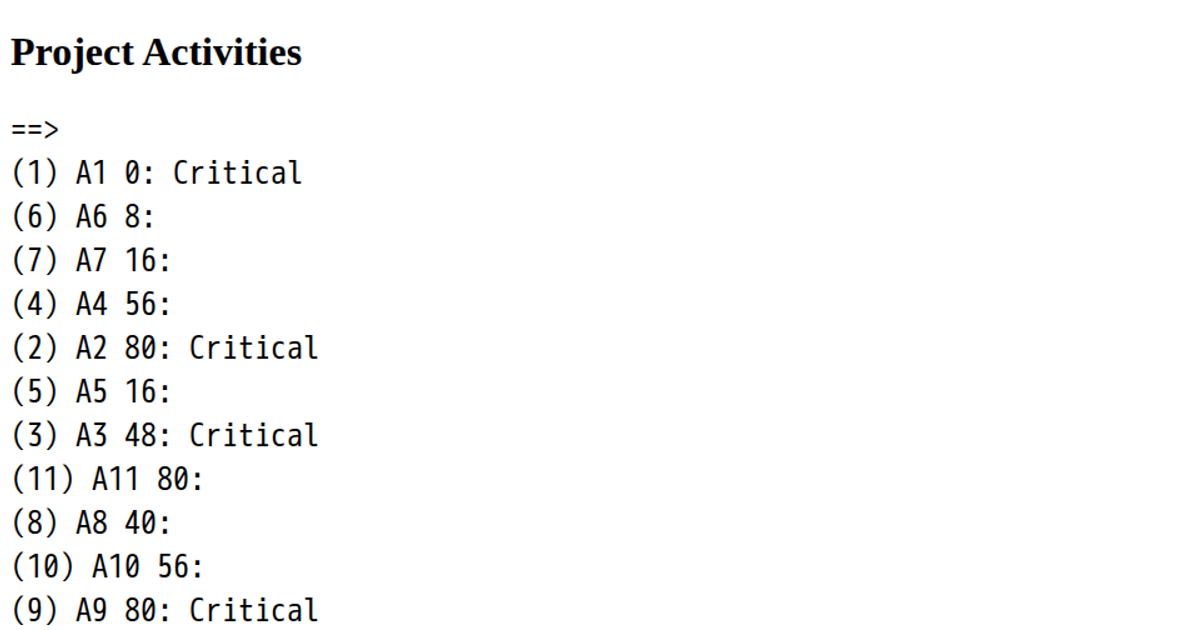
This example displays a plain-text summary of a tabular dataset about real projects. It loads two TSV files, `projects.tsv` and `activities.tsv`, using D3’s `tsv` function, then renders a report to the page via `select('body')`. The report shows the number of rows, columns, and size in kilobytes for each table, followed by a JSON-formatted preview of the first ten rows. The console output is styled with a black background and green monospace text.
AI-generated descriptionThis program prints a summary of a data table.
This data is about real projects.
This data comes from Operations Research & Scheduling Research Group.
MIT Licensed


Comments
Sign in to join the discussion.