CV: Unlocking Reorder.js
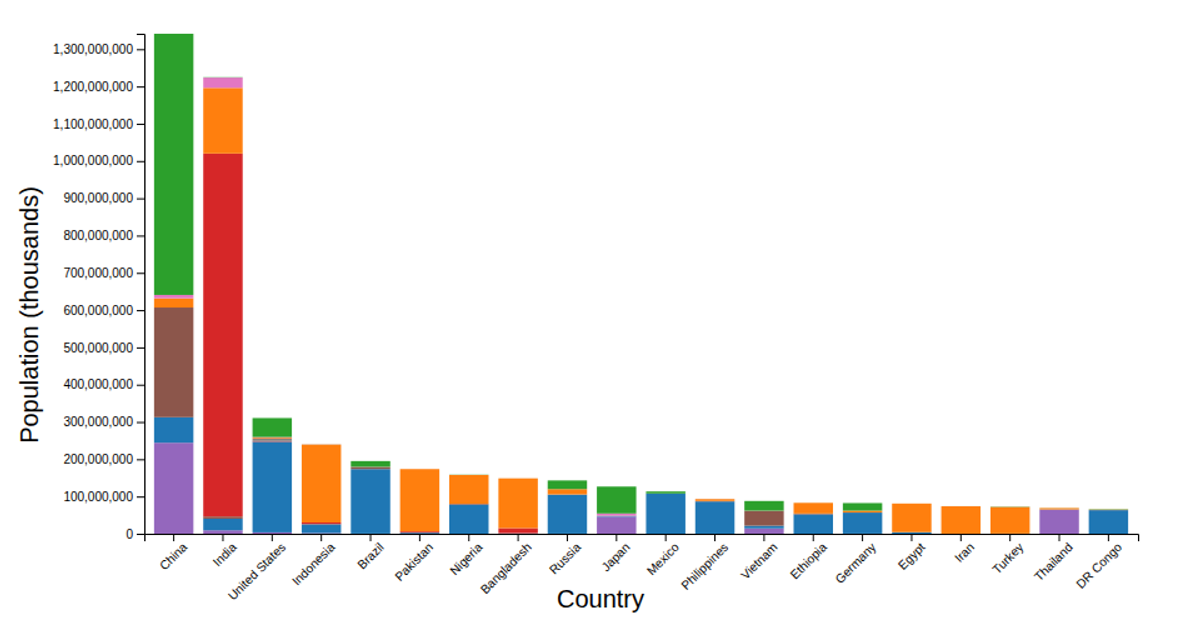
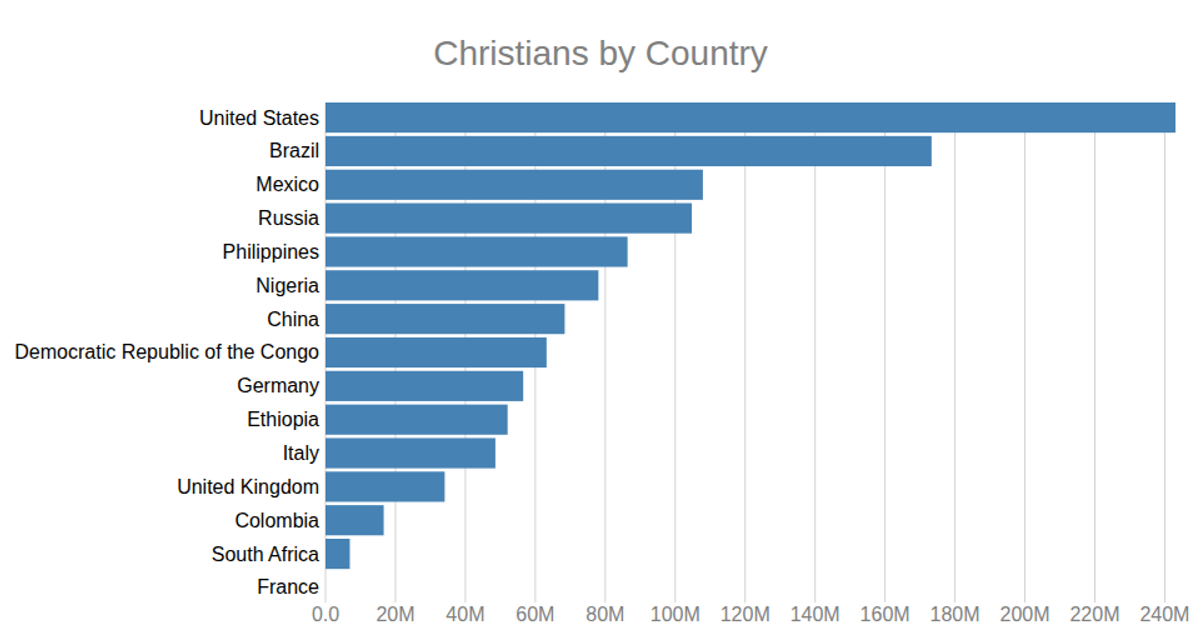
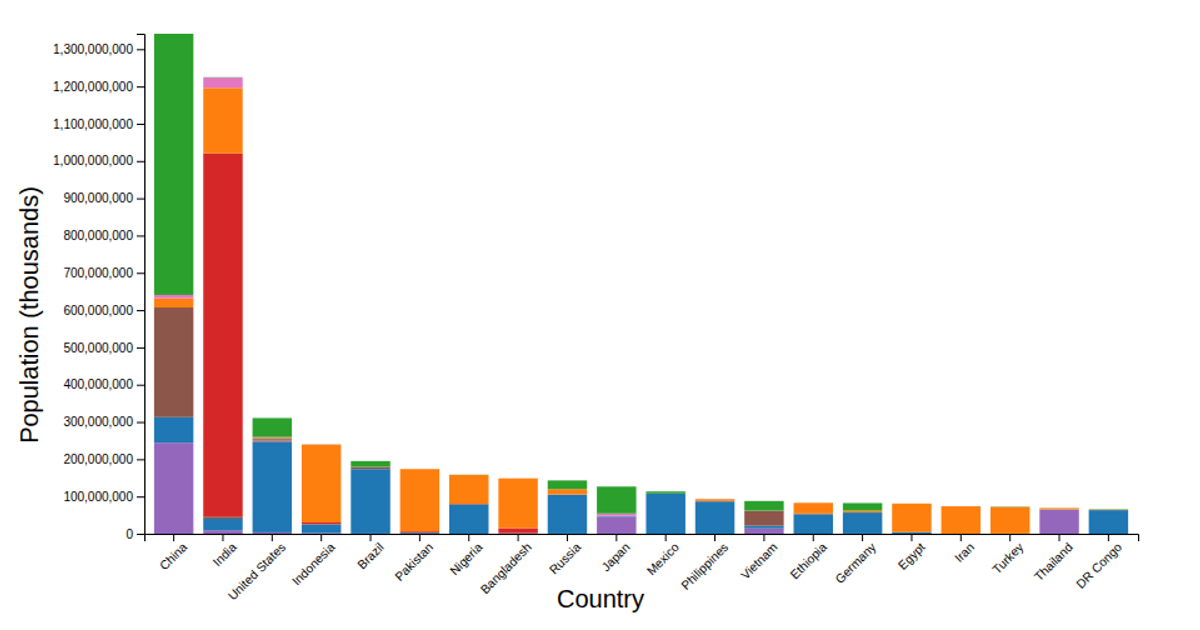
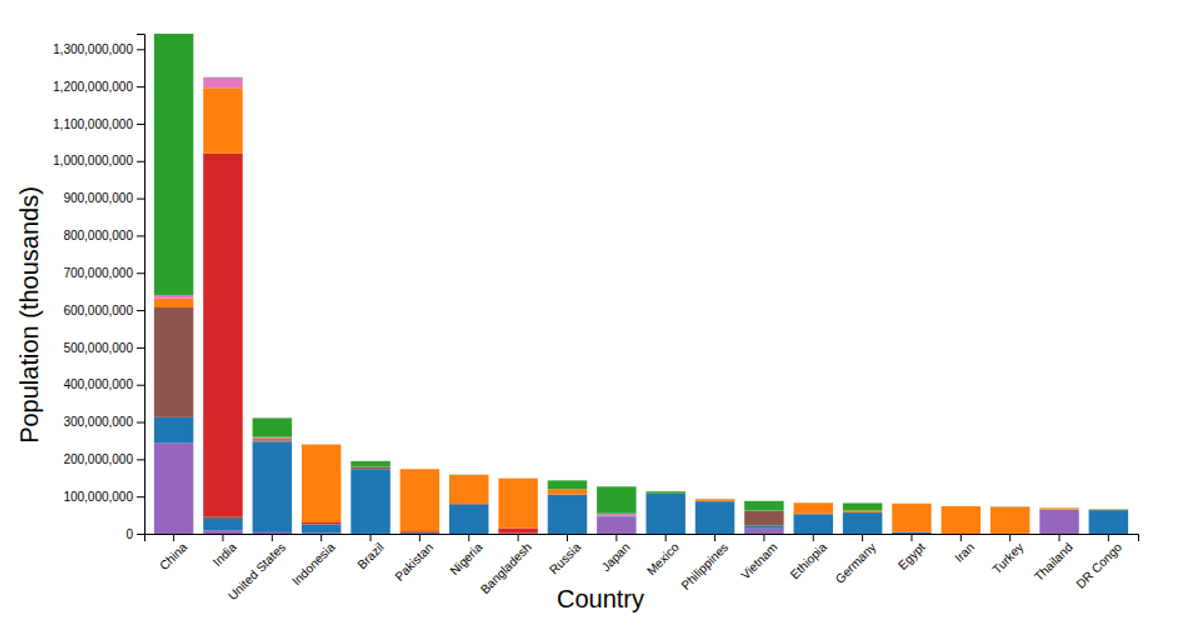
This interactive bubble chart visualizes religious population distributions across countries, with bubble size representing population counts and position encoding country and religion. A dropdown menu lets users reorder the matrix using Reorder.js algorithms including optimal leaf ordering, barycenter, and spectral ordering, revealing patterns in the demographic data. Built with React 19 and D3.js v7, the visualization uses SVG rendering with animated transitions between orderings, and includes click interaction to highlight individual bubbles. Data comes from the Pew Research Center's Global Religious Landscape study.
AI-generated descriptionReligious Demographics Visualization
An interactive bubble chart visualization showing religious population distribution across countries, built with React, D3.js, and Reorder.js.
Data is from The Global Religious Landscape by Pew Research, generated using this processing script.
Overview
This project visualizes religious demographic data using a bubble chart where:
- X-axis: Countries
- Y-axis: Religions
- Bubble size: Population count
- Interactivity: Click bubbles to highlight them
The visualization supports multiple matrix reordering algorithms from Reorder.js to reveal patterns in the data.
Features
- Interactive bubble chart with smooth transitions
- Multiple ordering algorithms:
- By Name: Alphabetical ordering (default)
- By Frequency: Sort by total population (rows/columns)
- Leaf Order: Optimal leaf ordering using hierarchical clustering
- Barycenter: Barycenter heuristic for bipartite graphs
- Spectral: Spectral ordering for graph layouts
- Responsive design that adapts to window size
- Click interaction to highlight individual data points
Tech Stack
- React 19: UI framework
- D3.js 7: Data visualization and scales
- Reorder.js: Matrix reordering algorithms
- ES Modules: Modern JavaScript with import maps
Data Format
The visualization uses a CSV file (data.csv) with the
following structure:



Comments
Sign in to join the discussion.