🌍 Public
task 3ex
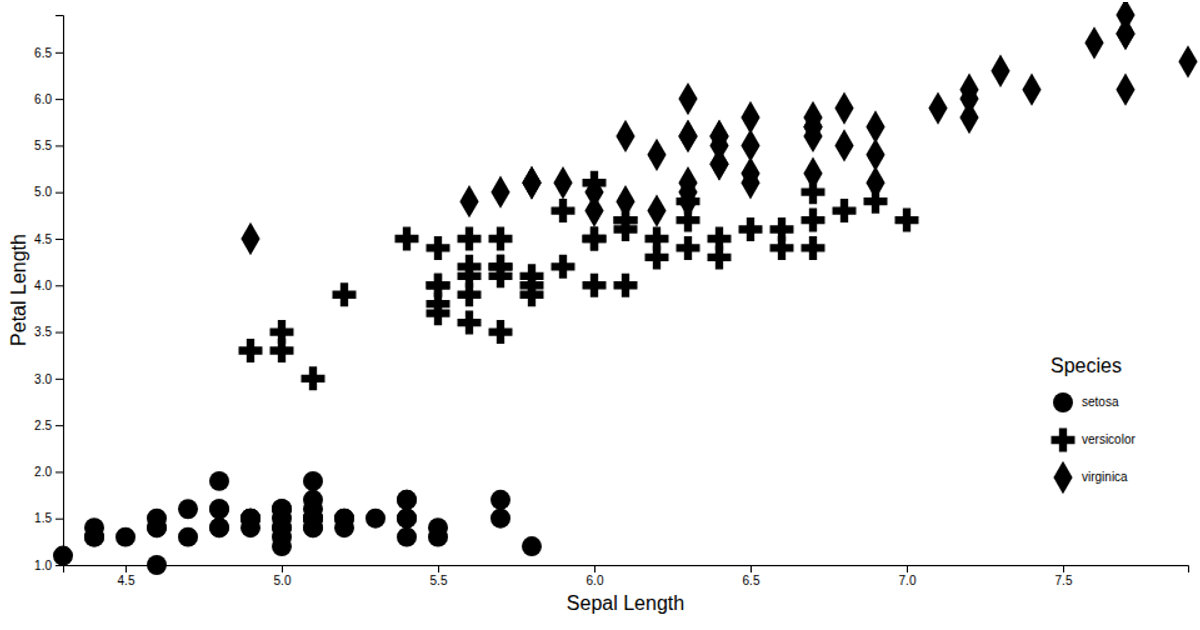
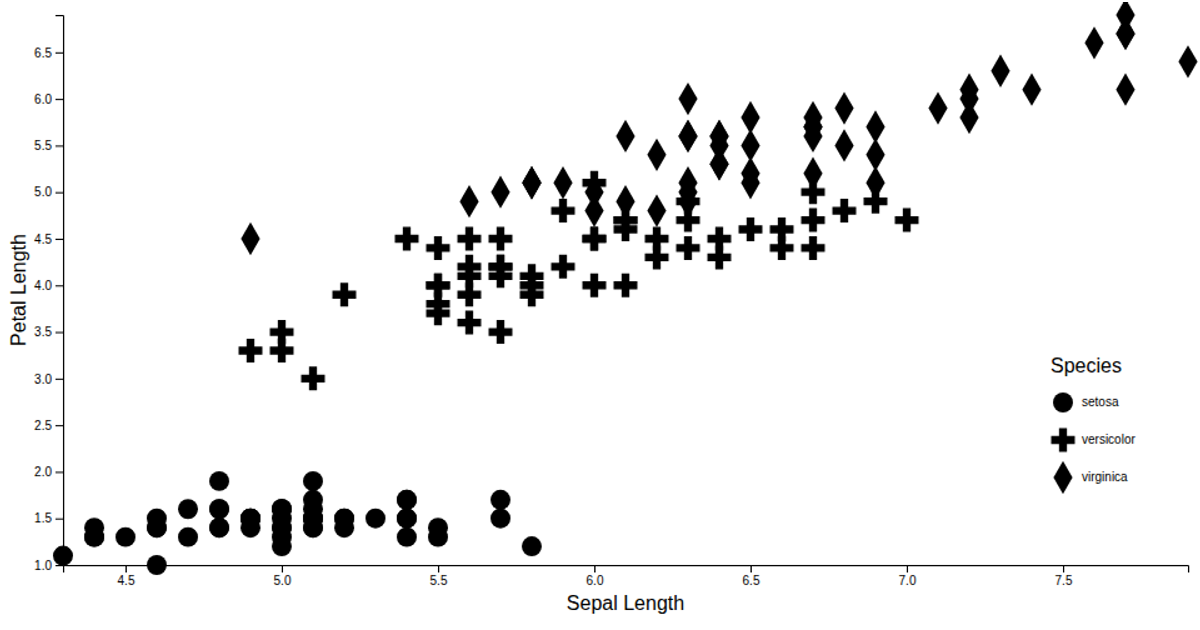
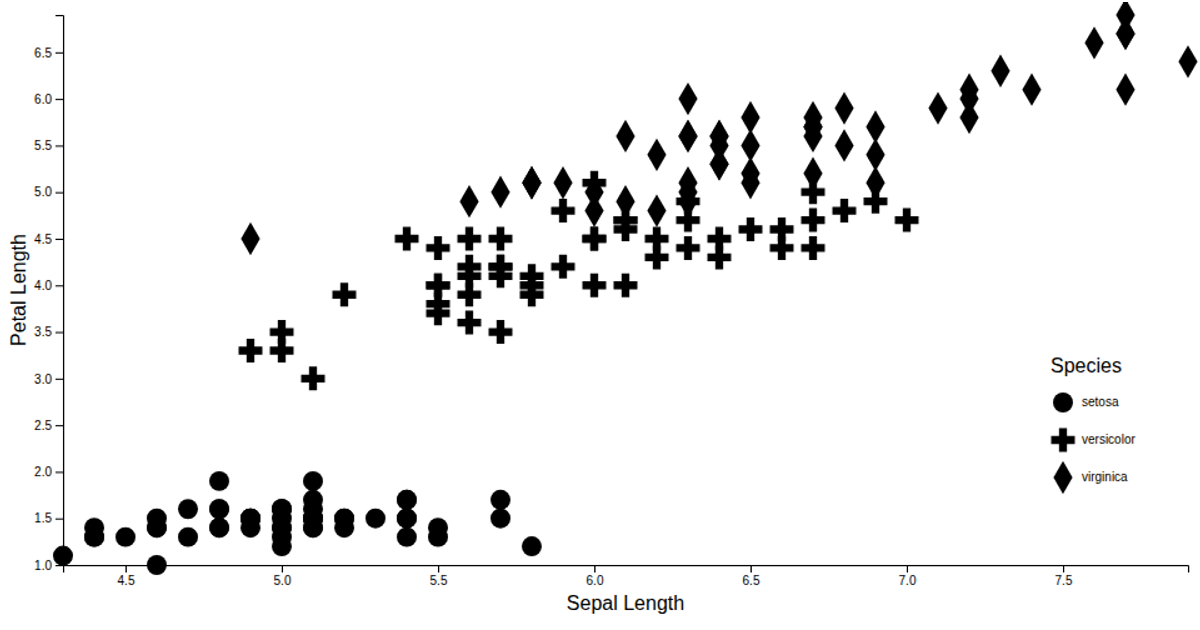
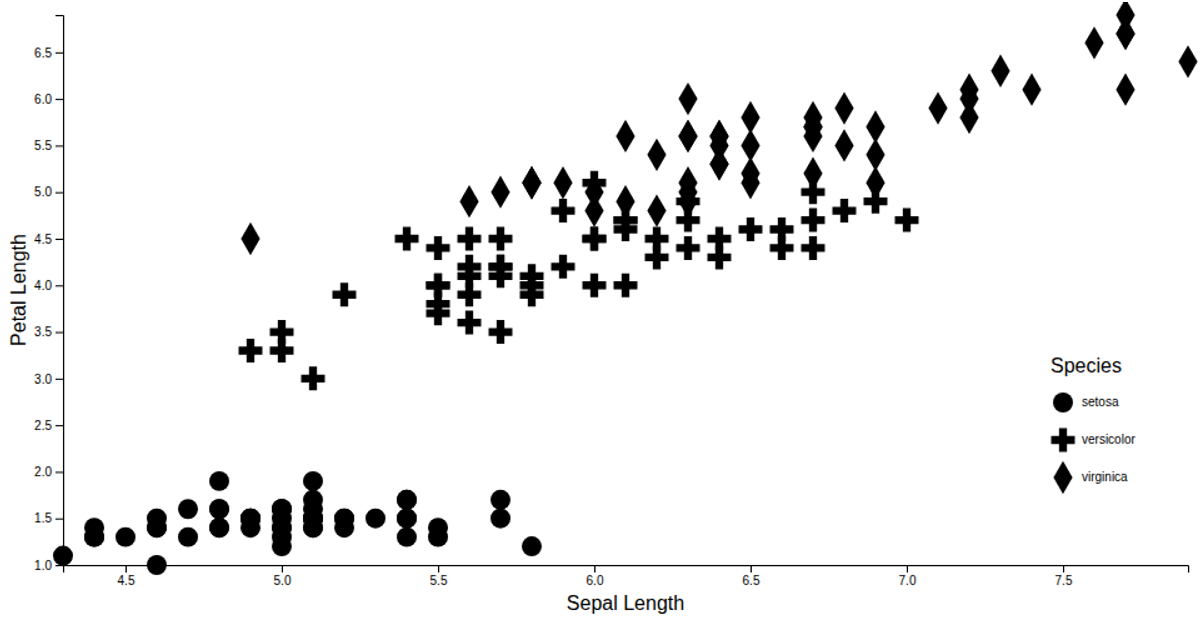
This scatter plot displays the relationship between sepal length and petal length for Iris flowers, with each point’s shape encoding the species. The chart uses d3.scaleLinear for the axes and d3.scaleOrdinal with d3.symbolsFill to map species to different point shapes. Axes and labels are drawn using d3.axisLeft and d3.axisBottom, while a custom legend is generated with d3.symbol. Data is fetched from a remote CSV and parsed with d3.csvParse, with numeric fields converted before rendering.
AI-generated descriptionMIT Licensed




Comments
Sign in to join the discussion.