🌍 Public
Pie Chart
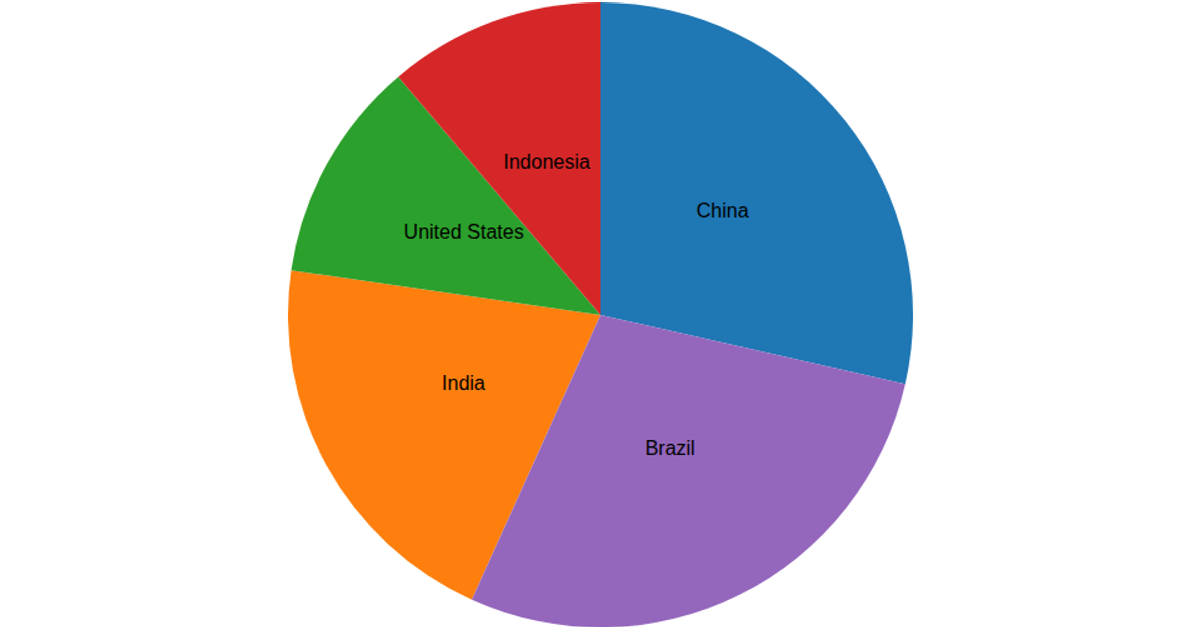
This pie chart visualizes the population distribution across 14 cities in Liaoning Province, China, using data from a CSV file. The chart renders as an SVG with donut-style arcs, where each slice’s arc length corresponds to a city’s population value, and city names are placed outside the ring using `d3.arc` and centroid positioning. The code uses `d3.pie()` to compute arc angles, `d3.scaleOrdinal` with `d3.schemeSet2` and `d3.schemeSet3` for colors, and `d3.arc().innerRadius(60).outerRadius(260)` to generate the paths, with labels positioned via an outer radius of 280.
AI-generated descriptionA bare minimum HTML page demonstrating use of CSS and JavaScript.
See also React Starter.
MIT Licensed




Comments
Sign in to join the discussion.