🌍 Public
Cost of Living World Map With Country Selection
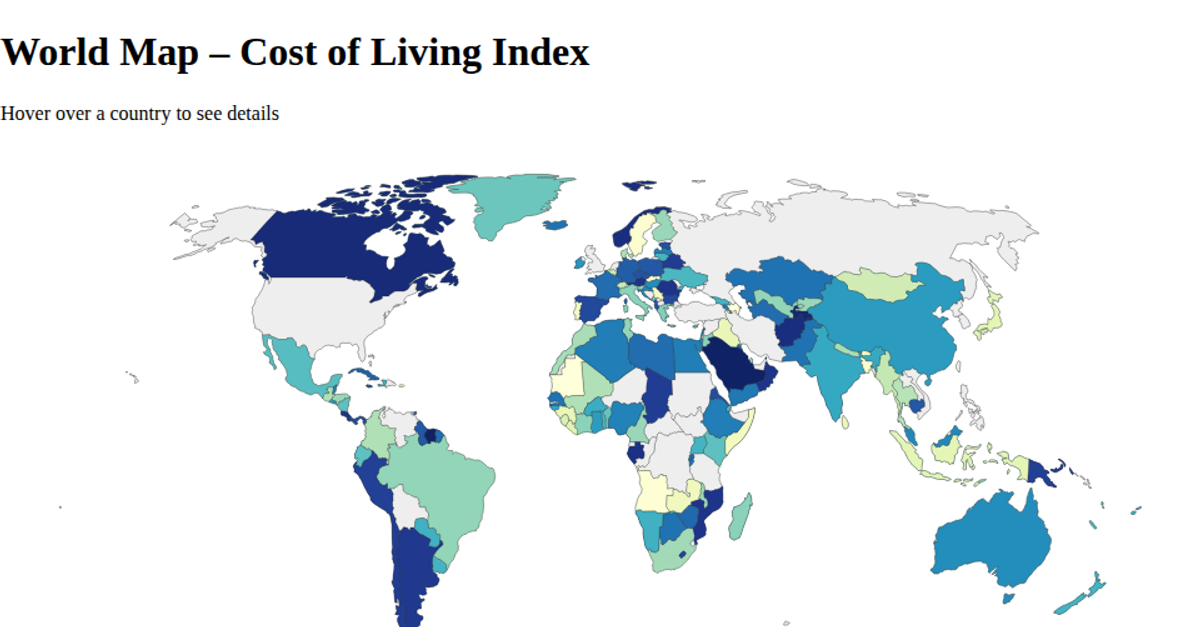
This interactive world map visualizes the cost of living index by country, using a red-to-blue color gradient where blue indicates higher costs. Hovering over a country reveals its name in green text. The visualization uses D3.js with `geoNaturalEarth1` projection and `geoPath` to render map features from TopoJSON data, while a sequential color scale maps the index values. The cost of living data is loaded from a local CSV file.
AI-generated descriptionSimple world map showing cost of living index per country represented by color gradient. Closer to blue is high cost of living while closer to red is low cost of living.
MIT Licensed




Comments
Sign in to join the discussion.