🌍 Public
Sample_Leaflet_starter
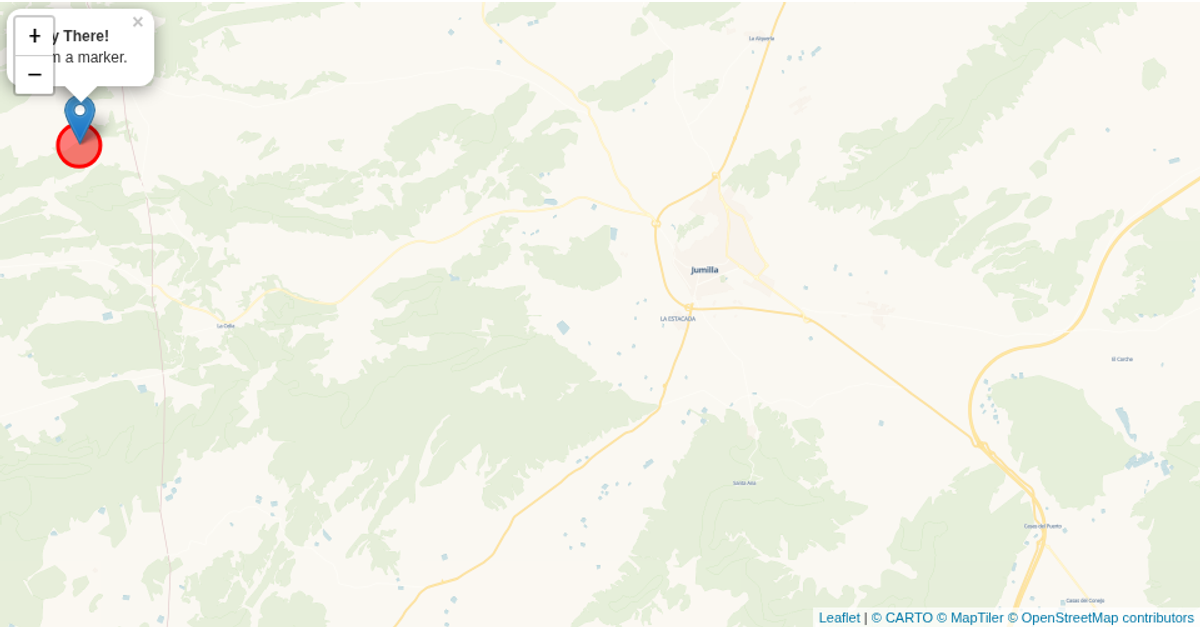
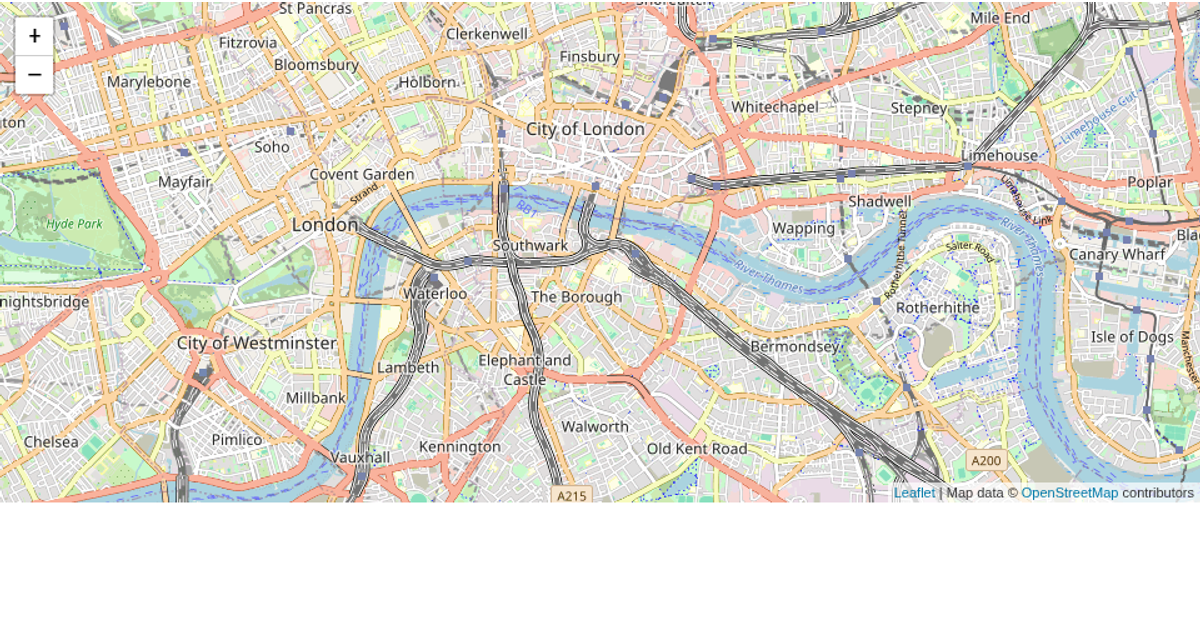
This example displays a map centered on a region in Syria, with an overlay of a list of three text items. It shows a map visualization using the Leaflet JavaScript library, with CartoDB’s Voyager tile layer providing the basemap. The page layout is constructed with HTML and CSS flexbox, placing the map and the list side by side. The code initializes the map with a specific latitude and longitude, sets the zoom level, and adds the tile layer. No interactive features are demonstrated beyond the static map display, and the list items are placeholders without associated map interactions.
AI-generated descriptionA bare minimum HTML page demonstrating use of CSS and JavaScript.
See also React Starter.
MIT Licensed






Comments
Sign in to join the discussion.