🌍 Public
Vikas Reusable D3 Scatter Plot
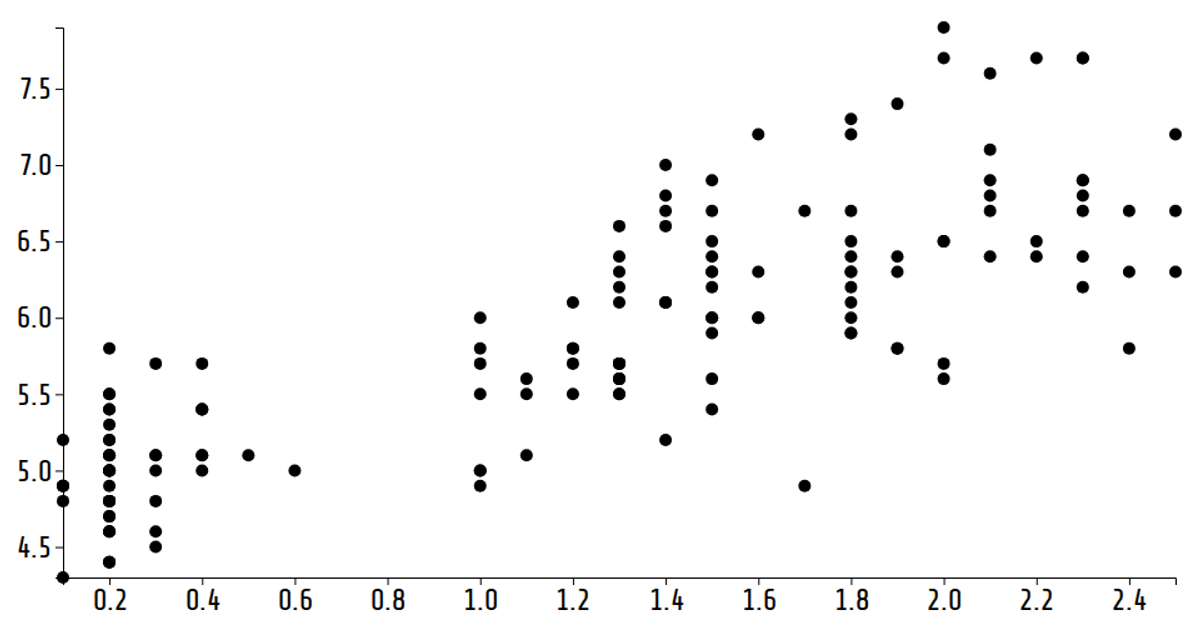
This interactive scatter plot visualizes the Iris dataset, cycling through four feature pairs as its axes every few seconds. Built with reusable D3 v6 code, it uses animated transitions to rotate between sepal length/width and petal length/width, rendering species in orange, blue, and black circles. The SVG visualization includes a color-coded legend, axis labels, and a title, with the animation driven by setInterval to update the x-scale.
AI-generated descriptionA reusable scatter plot inspired by Towards Reusable Charts.
Shows the Iris Dataset.
MIT Licensed




Comments
Sign in to join the discussion.