🌍 Public
Color and Size Legend
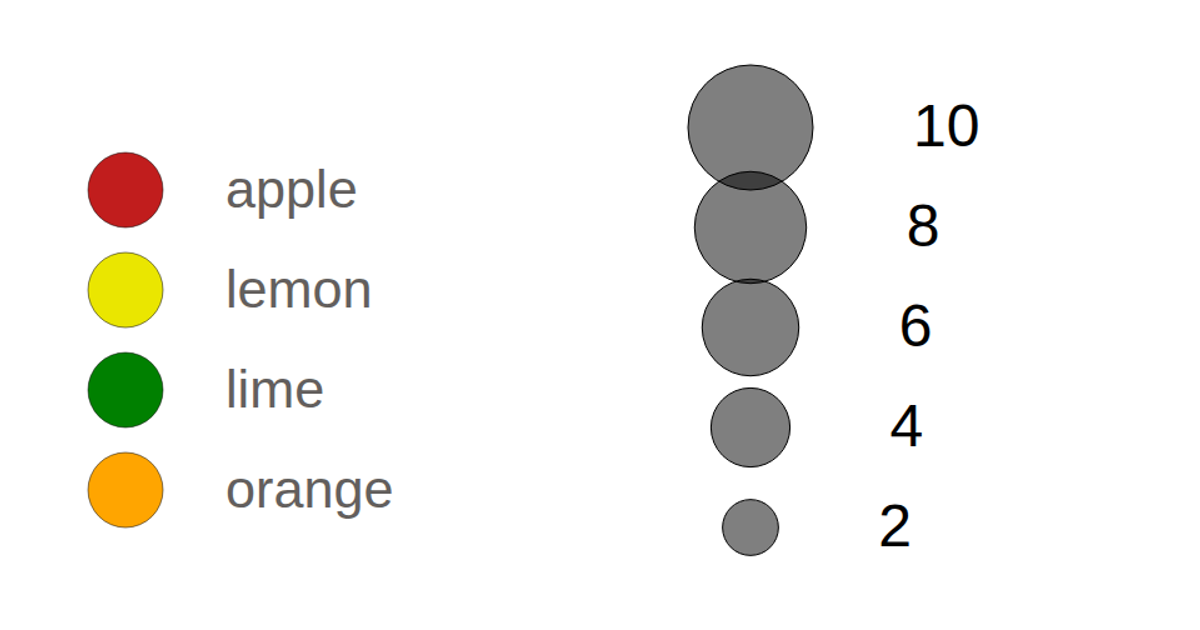
Two custom legend components demonstrate how to encode data through color and size. The color legend uses a D3 ordinal scale with four fruit categories, while the size legend uses a square-root scale with five tick values. Both legends are rendered as SVG groups using reusable functions that handle enter/update/exit selections. The code uses `d3.scaleOrdinal`, `d3.scaleSqrt`, and selection methods like `merge` and `attr` to position circles and text labels with consistent spacing.
AI-generated descriptionReact Starter code.
MIT Licensed




Comments
Sign in to join the discussion.