🌍 Public
Fork of Scatter Plot Including Species
NNita
Last edited Jun 12, 2021
Created on Jun 12, 2021
Forked from Scatter Plot with Menus Including Species
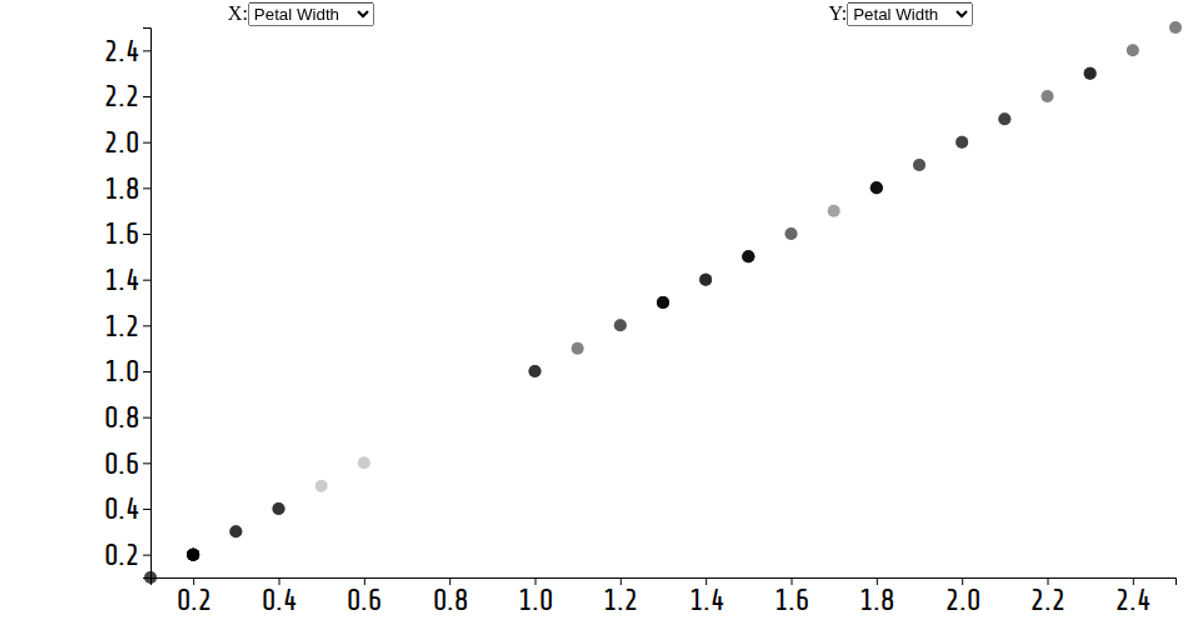
This interactive scatter plot visualizes the Iris Dataset, displaying measurements across quantitative axes selected via dropdown menus. The visualization implements a reusable chart pattern with `scatterPlot` and `menu` modules, using D3 v6's `selection.join` for smooth circle transitions and axis updates. Users can switch between petal width, sepal width, petal length, and species for either axis, triggering animated updates through `d3.transition`. Species data appears as categorical values, though the code currently maps multiple options to the same species column.
AI-generated descriptionA reusable scatter plot inspired by Towards Reusable Charts and Observable: selection.join.
Shows the Iris Dataset.
MIT Licensed


Comments
Sign in to join the discussion.