🌍 Public
Fork of Shapes with SVG
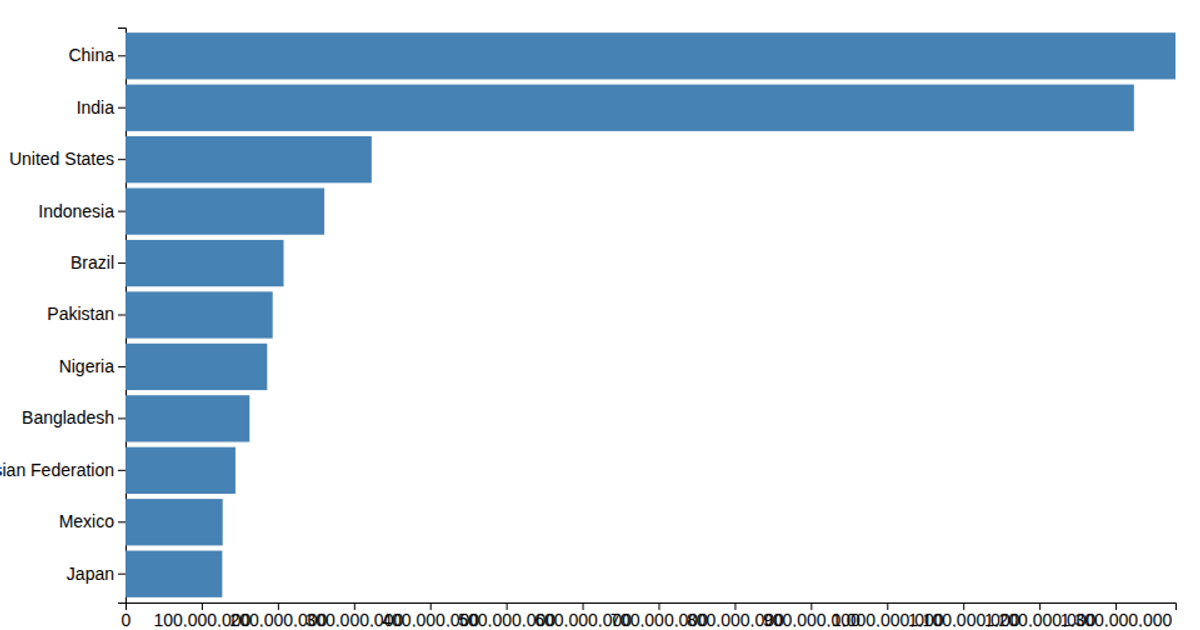
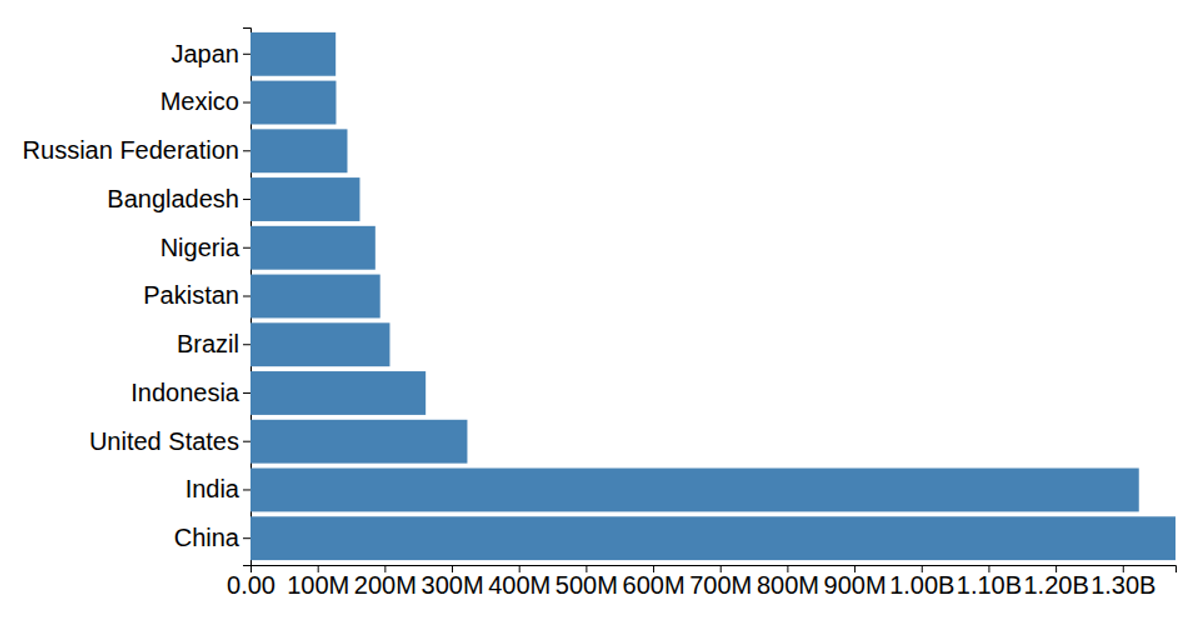
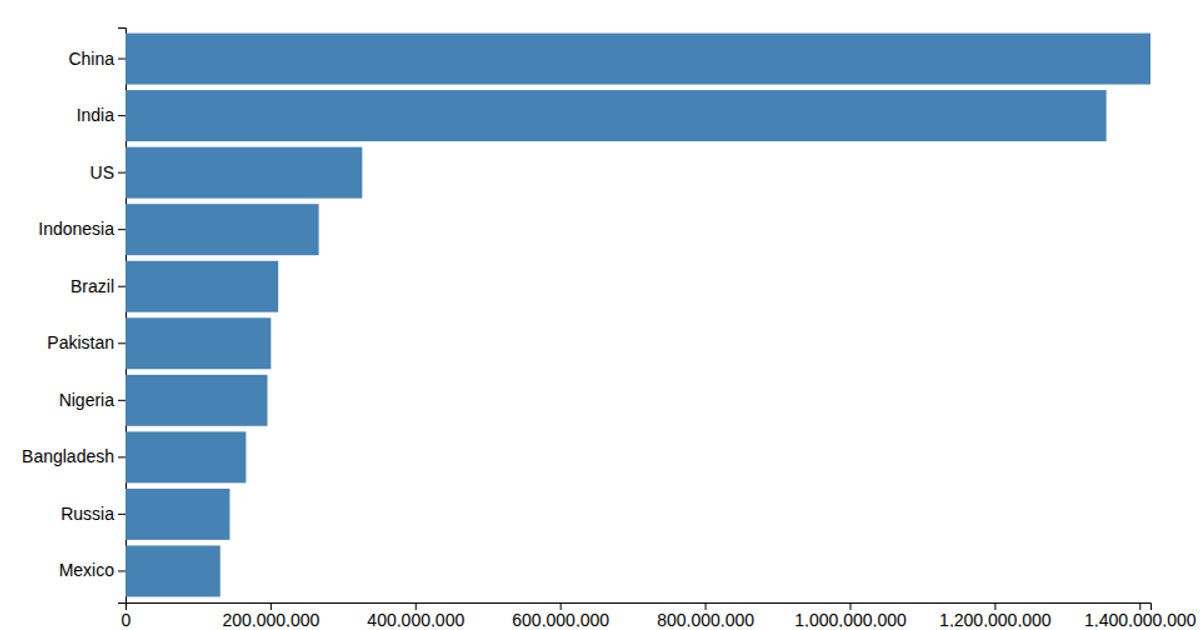
This visualization displays population data for 14 countries using horizontal bars rendered as SVG rectangles. The code loads data from a CSV file and multiplies the population values by 1000. It uses d3.scaleLinear for the x-axis scale and d3.scaleBand for the y-axis, though the bar heights are fixed at 300 pixels and the y-scale is not applied to the rectangles. The example demonstrates basic data loading with d3.csv, scaling, and SVG element creation.
AI-generated descriptionMIT Licensed





Comments
Sign in to join the discussion.