🌍 Public
Box Plot
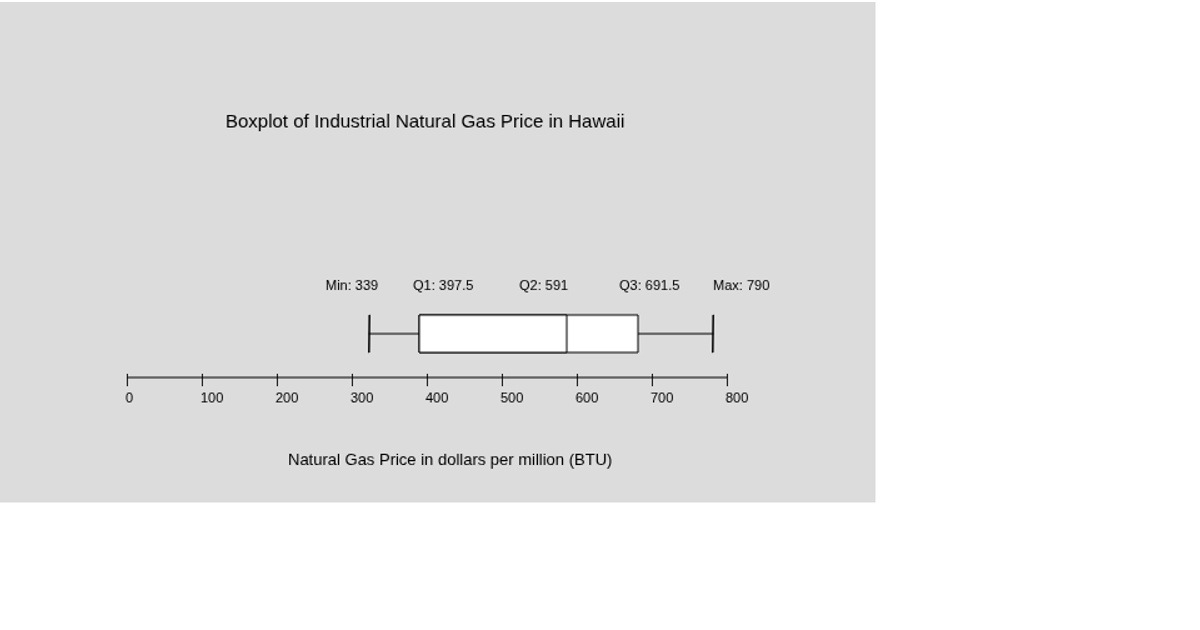
This interactive p5.js visualization displays a box plot of California state expenditures from 1992 to 2019, with values loaded from a remote CSV file and normalized to units of $10 million. The sketch uses p5.js functions like `loadTable()`, `sort()`, and canvas drawing primitives (`line()`, `point()`, `text()`) to render the median, quartiles, and whiskers on a static 740x520 canvas, with axes and tick labels marking expenditure values.
AI-generated descriptionA bare minimum HTML page demonstrating use of CSS and JavaScript.
See also React Starter.
MIT Licensed


Comments
Sign in to join the discussion.