🌍 Public
Sized Points on a Map
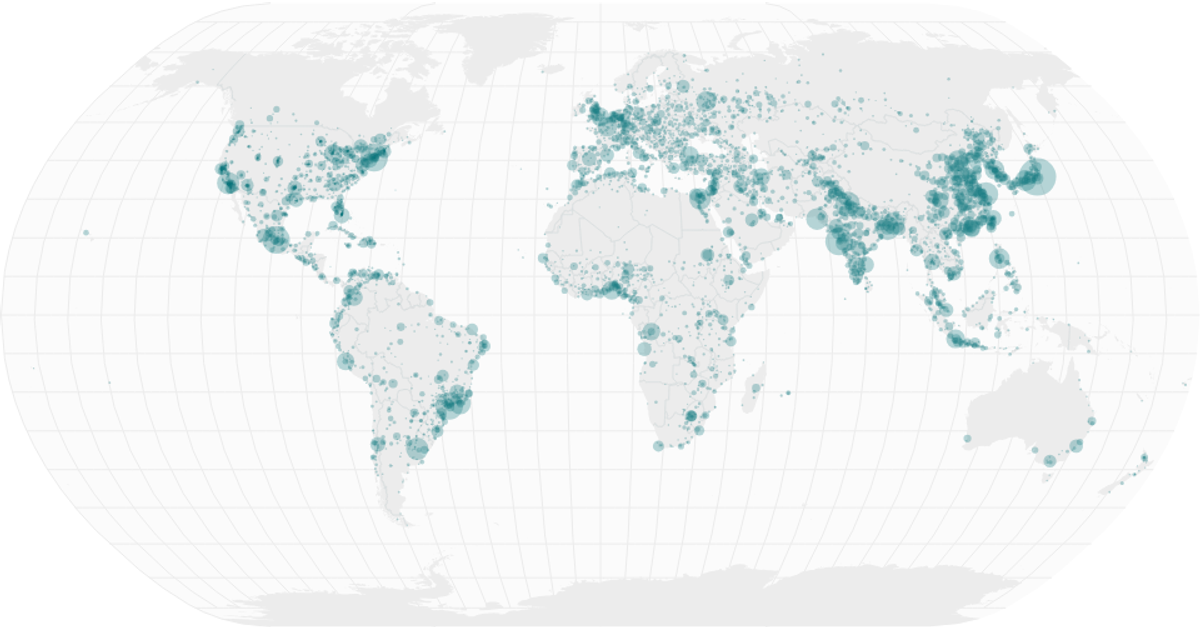
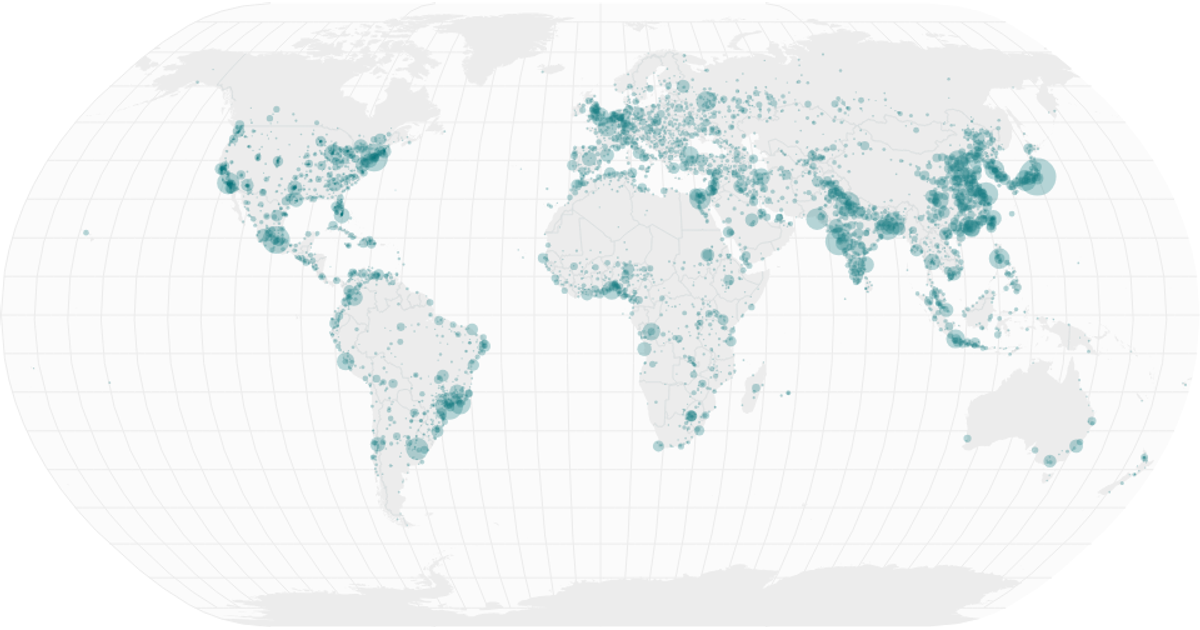
The map displays hospital beds per 1000 people, with each city represented by a circle whose area is proportional to the value. The geographic context is drawn using `d3.geoPath` with a `geoNaturalEarth1` projection, incorporating graticules, land masses, and country interiors. City data is loaded via `d3.csv` and scaled using `scaleSqrt`. The visualization is rendered in a React component, producing SVG marks over a subtle, polished basemap sourced from the World Atlas TopoJSON.
AI-generated descriptionA world map showing hospital beds per 1000 people. Data from World Bank.
Country boundaries from World Atlas TopoJSON, polished for visual style, including graticules.
MIT Licensed




Comments
Sign in to join the discussion.