🌍 Public
ICE-6 Bar Graph
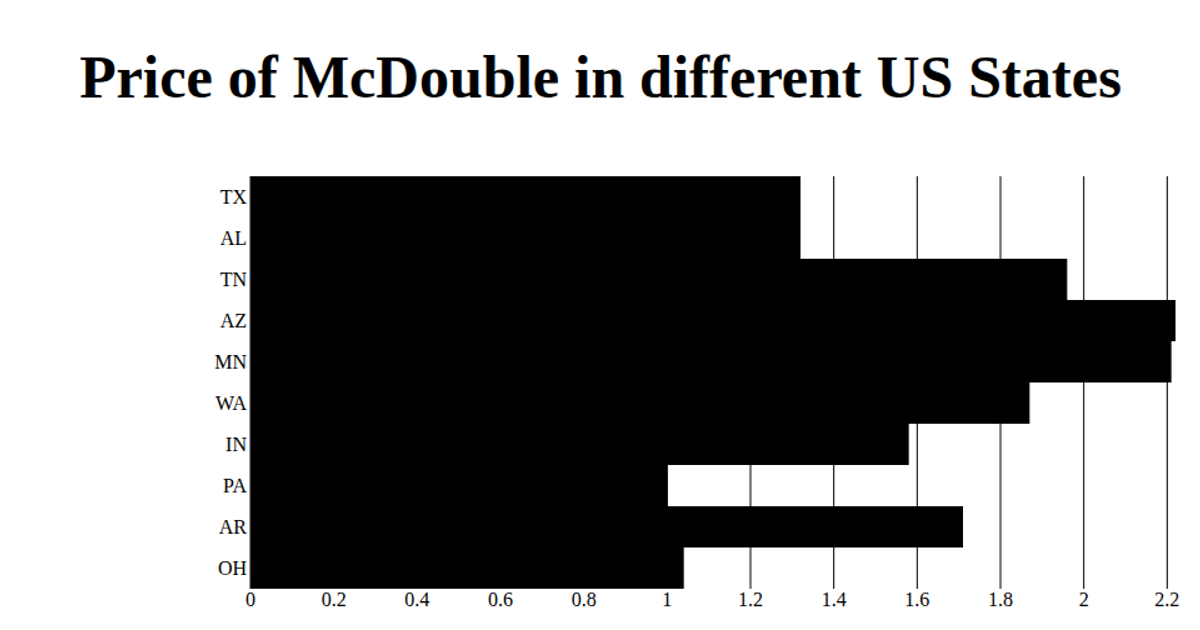
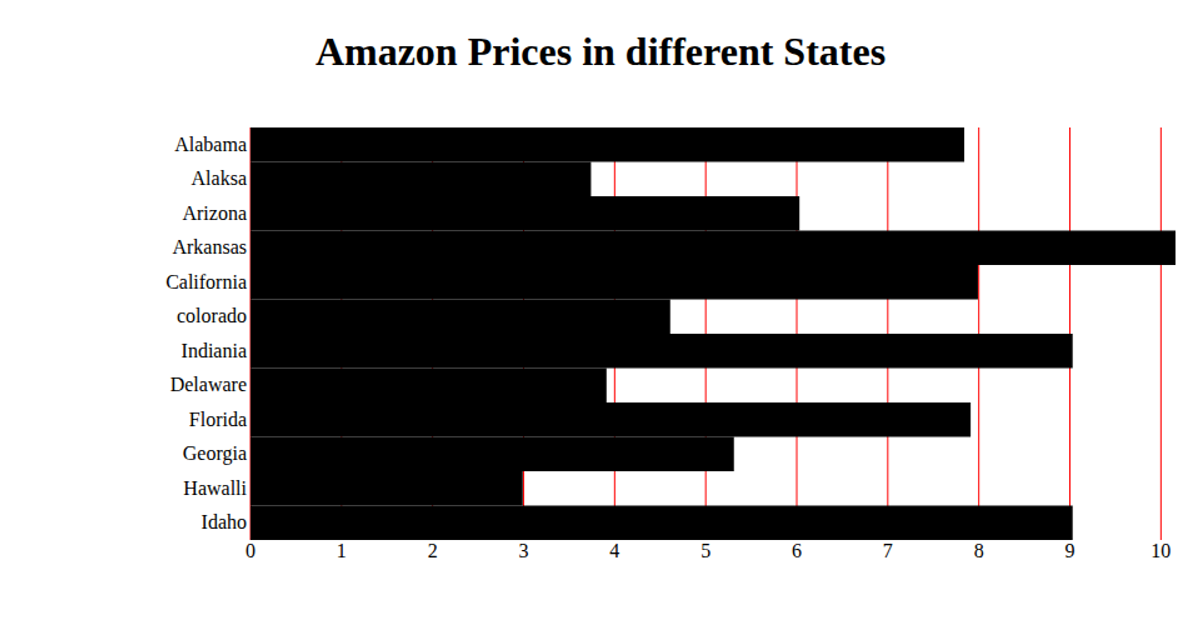
This example shows the prices of twelve Burger King menu items in a horizontal bar chart. Each bar’s length encodes the item’s price using a linear scale, with a red gridline for each tick on the x-axis. The chart is built with React and D3 v5, using `scaleBand` for the y-axis item categories and `scaleLinear` for price values, while `csv` loads the data from a GitHub gist. Bars are rendered as SVG rectangles, with axis ticks generated manually via `xScale.ticks()`.
AI-generated descriptionA whole smiley face
MIT Licensed





Comments
Sign in to join the discussion.