🌍 Public
loading data with d3 and react
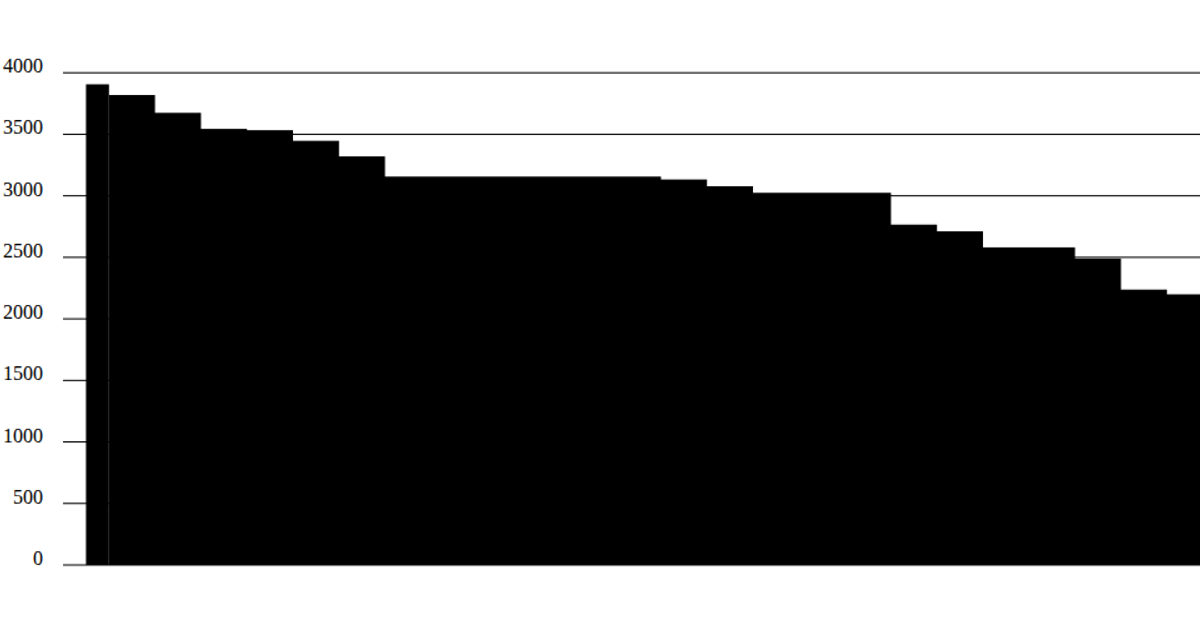
This example shows a bar chart of Tunisia’s GDP over time, displayed as SVG elements rendered by React. It loads a CSV file using `d3.csv`, then uses `scaleLinear` for the y-axis and `scaleTime` for the x-axis to map data points. The chart displays loading text until data arrives, and renders grid lines with tick labels from the scales.
AI-generated descriptionA program that follows your mouse with a circle.
MIT Licensed





Comments
Sign in to join the discussion.