🌍 Public
Pseudo Bar Chart
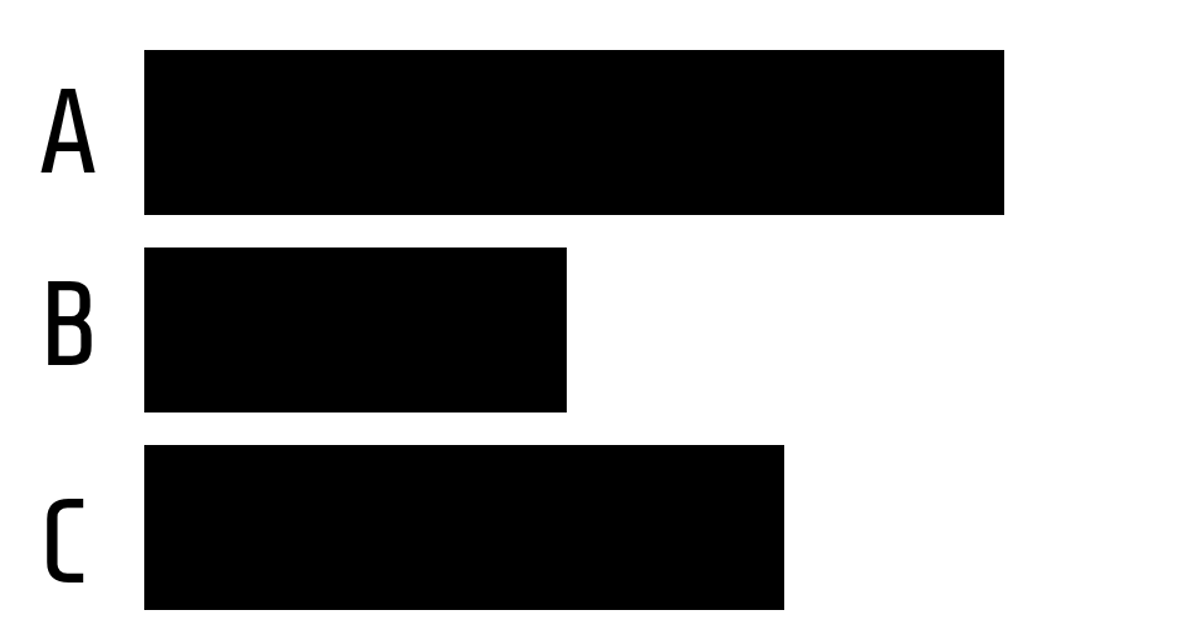
This pseudo bar chart uses black rectangles to represent categorical values A through D, with varying heights that suggest a bar chart’s visual hierarchy while omitting traditional axes. The SVG code explicitly places four rectangles and paired text labels, demonstrating a static, hand-coded layout. It relies on React’s rendering approach via the v3 framework, though the visible implementation uses raw SVG elements and CSS styling with the Share Tech font. No data binding or dynamic computation occurs; the chart is purely declarative.
AI-generated descriptionA bare minimum HTML page demonstrating use of CSS and JavaScript.
See also React Starter.
MIT Licensed





Comments
Sign in to join the discussion.