🌍 Public
Untitled
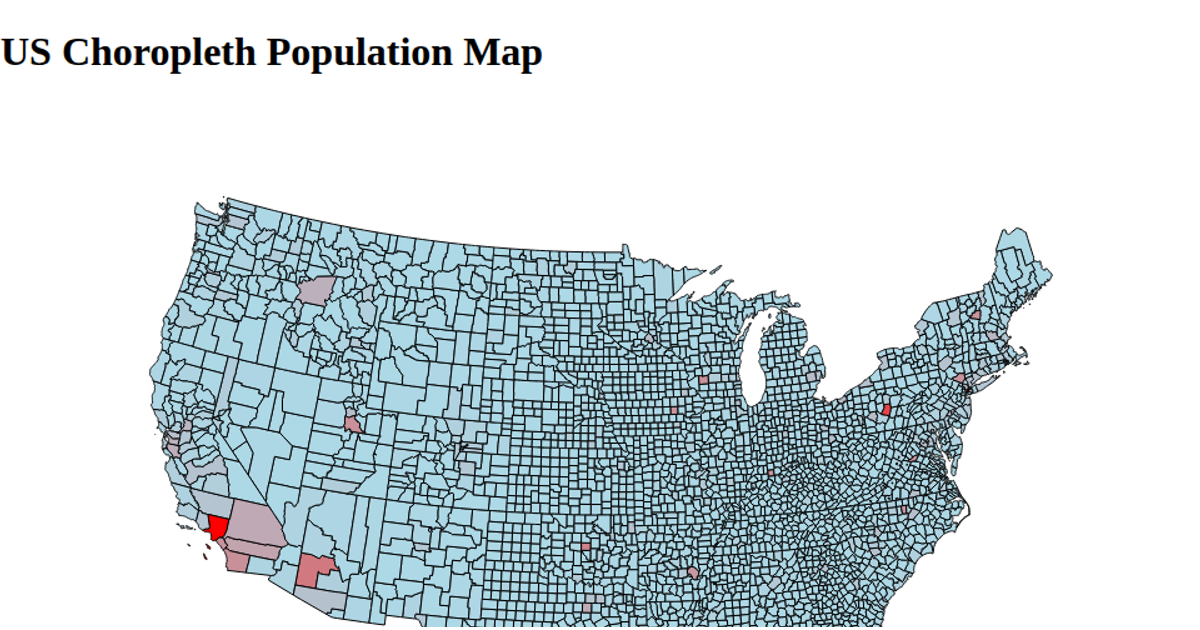
This choropleth map displays U.S. county-level education data, with each county drawn as a filled path whose color would encode the associated metric. The visualization loads county boundaries from a TopoJSON file and joins them with a separate JSON dataset containing education statistics. Using d3.geoPath, the code renders the geographic features into an SVG canvas, while d3.json is used to fetch both data sources sequentially, ensuring the map draws only after all data arrives.
AI-generated descriptionMIT Licensed





Comments
Sign in to join the discussion.