🌍 Public
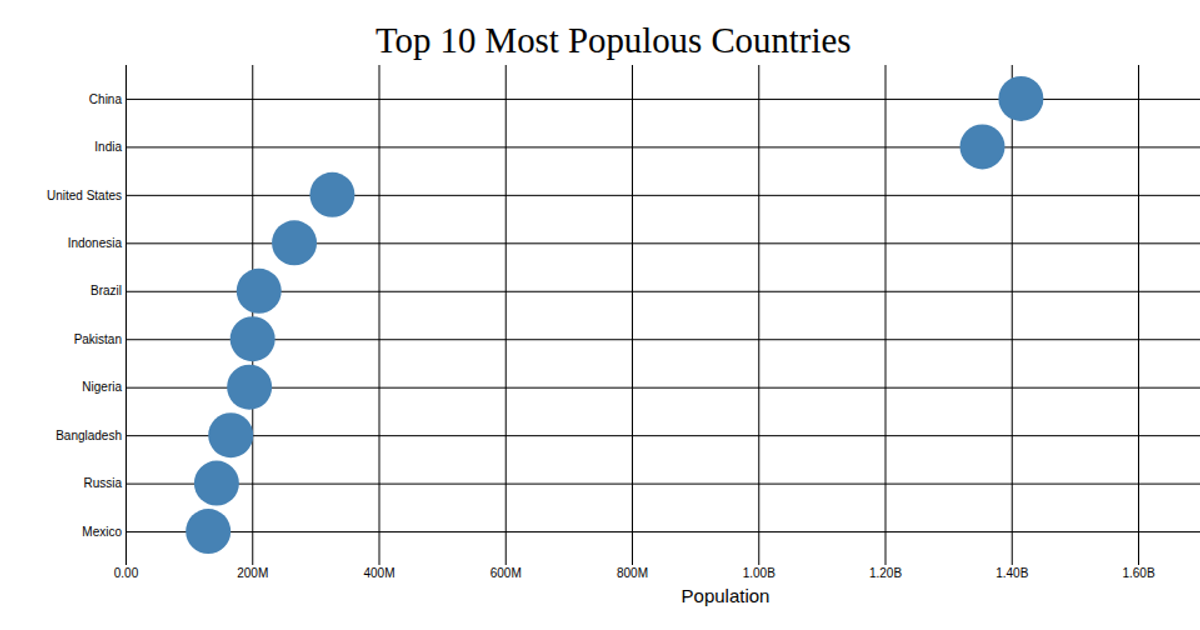
Scatter plot with customize axes
This scatter plot visualizes the top 10 most populous countries, with population on the x-axis and country names on the y-axis. The chart uses D3 v5’s `scaleLinear` and `scalePoint` to map the data, and customizes both axes with `axisLeft` and `axisBottom`, including formatted tick labels via `format('.3s')` and grid lines. Data comes from a CSV file and is rendered as SVG circles in React.
AI-generated descriptionA bare minimum HTML page.
See also React Starter.
MIT Licensed


Comments
Sign in to join the discussion.