🌍 Public
Tutorial_2_sivani
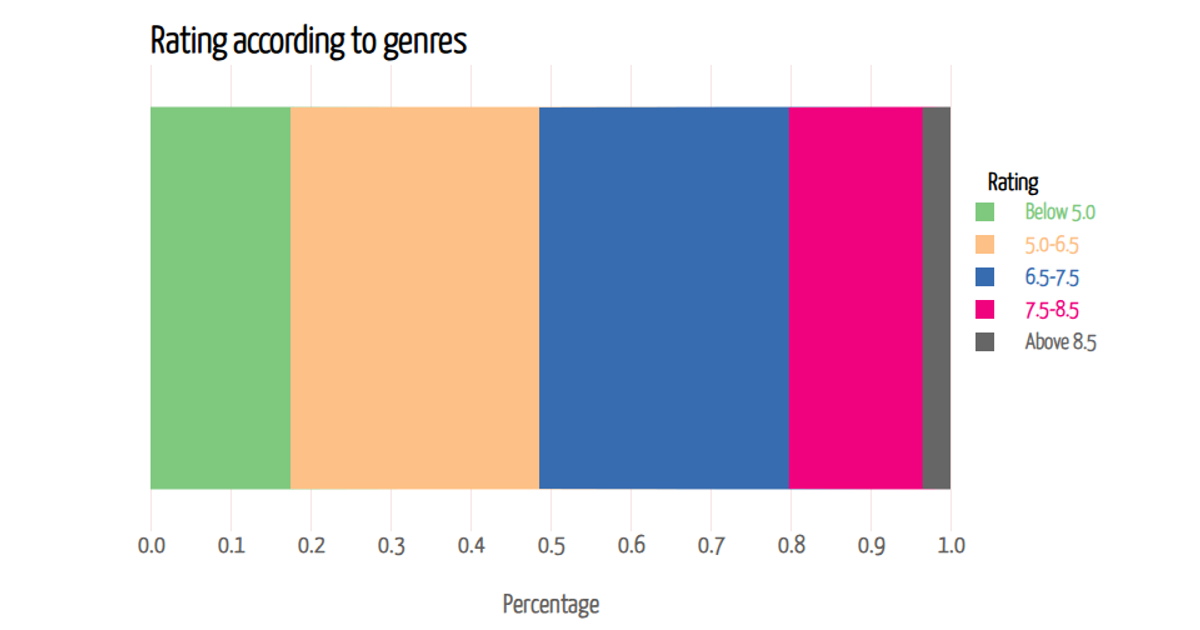
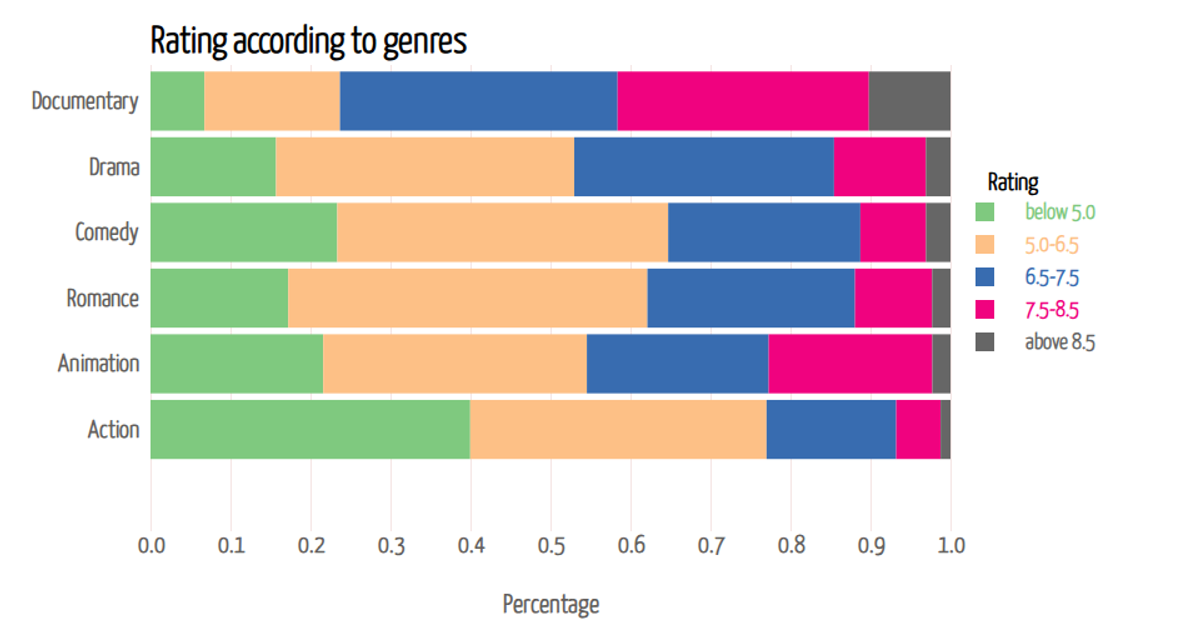
A stacked horizontal bar chart shows the distribution of IMDb ratings across six movie genres, with each bar divided into five rating brackets from below 5.0 to above 8.5. The visualization uses d3.stack() to compute the stacked segments and d3.scaleOrdinal with five distinct colors to differentiate the rating categories. A tooltip appears on mouseover, displaying the exact percentage for each genre-rating combination. The chart is rendered as SVG with d3.v7, using scales like d3.scaleLinear and d3.scaleBand, and reads data from a CSV file containing genre percentages.
AI-generated descriptionMIT Licensed





Comments
Sign in to join the discussion.