🌍 Public
Activity6_q3
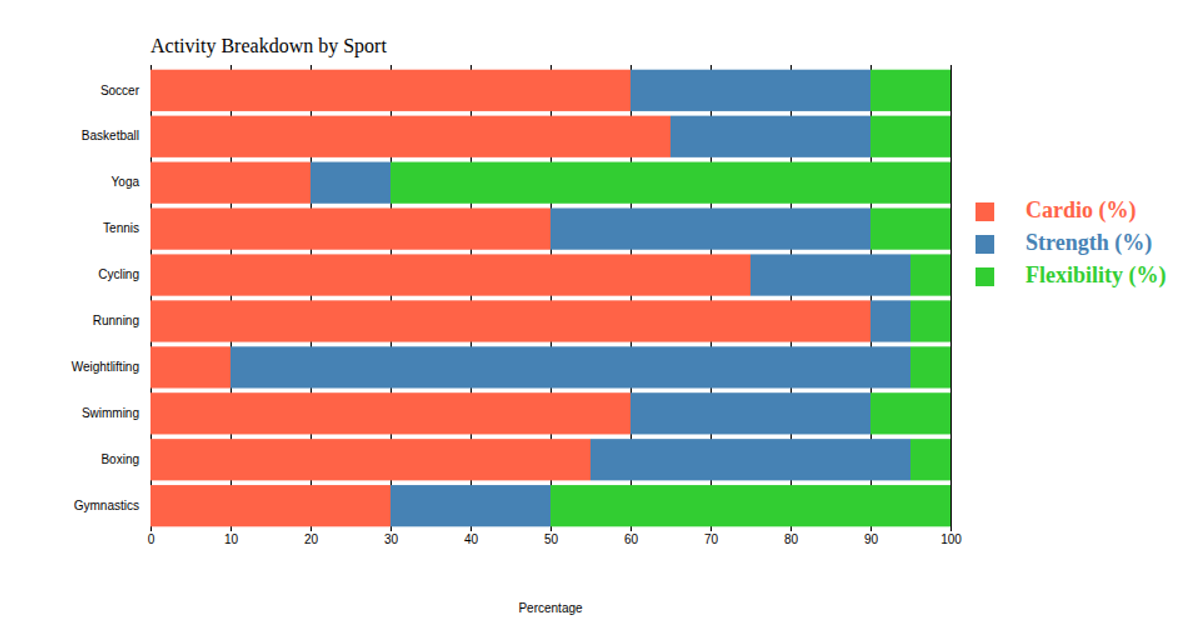
This visualization shows the percentage contribution of five statistical categories—points, rebounds, assists, steals, and blocks—for ten NBA players, using a stacked horizontal bar chart where each player’s row sums to 100%. The code loads data from a CSV via `d3.csv`, normalizes each player’s stats, and renders the SVG with `d3.stack()`, `d3.scaleOrdinal` for colors, and `d3.scaleBand` for the y-axis. Interactive tooltips appear on mouseover, displaying the category’s percentage using `d3.format`.
AI-generated descriptionMIT Licensed




Comments
Sign in to join the discussion.