Anscombe Vega-Lite API
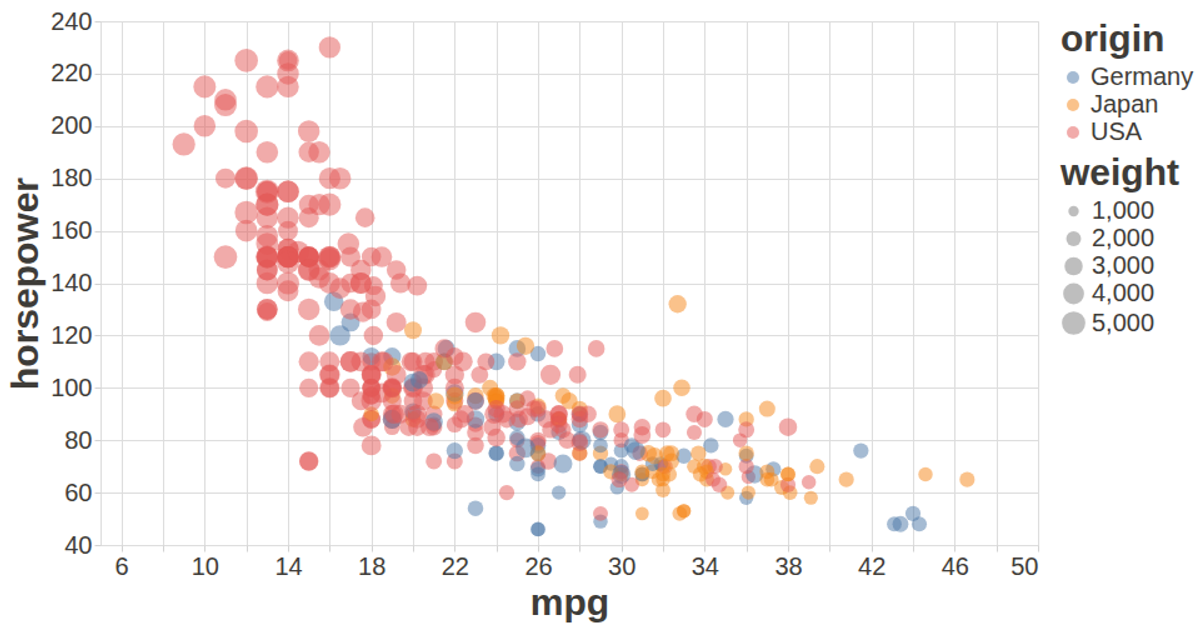
This visualization displays Anscombe's quartet, a set of four datasets with identical statistical properties but distinct visual patterns, rendered as a faceted scatter plot. Circles encode the x and y coordinates, with color distinguishing the four groups. Built using the Vega-Lite API, the example dynamically loads data from a CSV file hosted on Gist, which is sourced from the UCI Machine Learning Repository's Auto MPG dataset. The code creates the visualization in JavaScript using the vega-lite-api library, which is configured with a custom color scheme and font sizes for improved readability, and renders the final chart to SVG.
AI-generated descriptionA visualization constructed using the vega-lite-api.
The data shown here comes from the UCI Machine Learning Repository: Auto MPG Data Set, via Gist: Scatter Plot with Menus.


Comments
Sign in to join the discussion.