🌍 Public
Fork of Working with
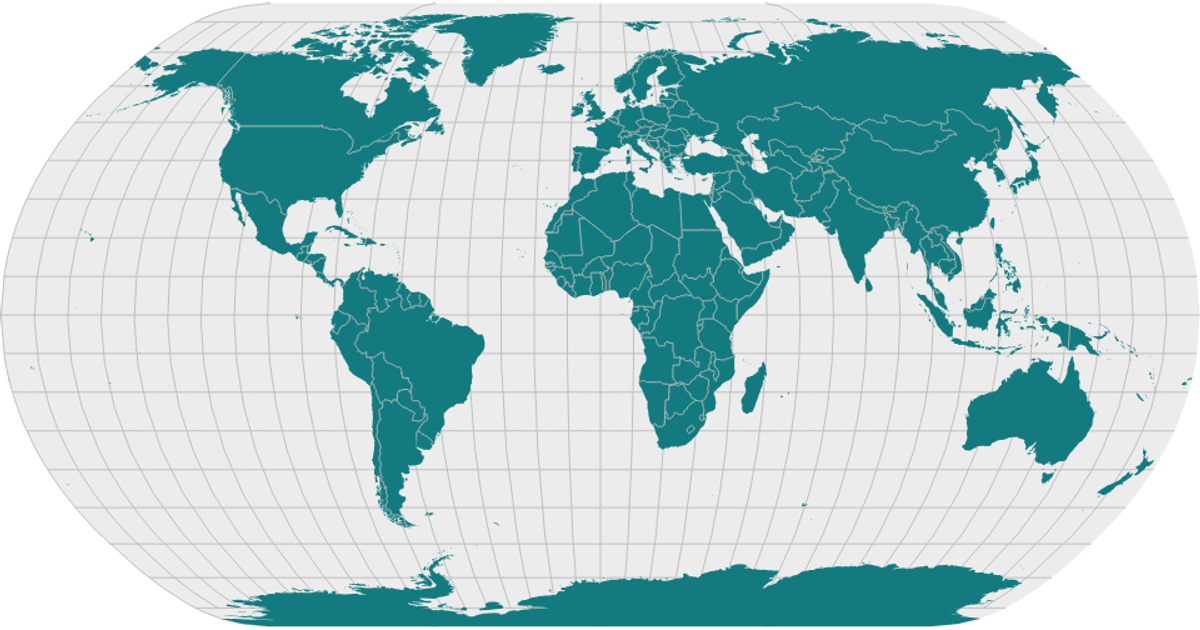
This example displays a world map visualization of the Data Canvas Sense Your City dataset, rendered as SVG paths. Using React hooks for state management, the code fetches TopoJSON country boundaries and converts them to GeoJSON with `topojson.feature`. The `d3.geoEqualEarth` projection and `d3.geoPath` generate the map shapes, which are styled with cyan fill and gray strokes. The visualization loads geographic data from the unpkg-hosted world-atlas package.
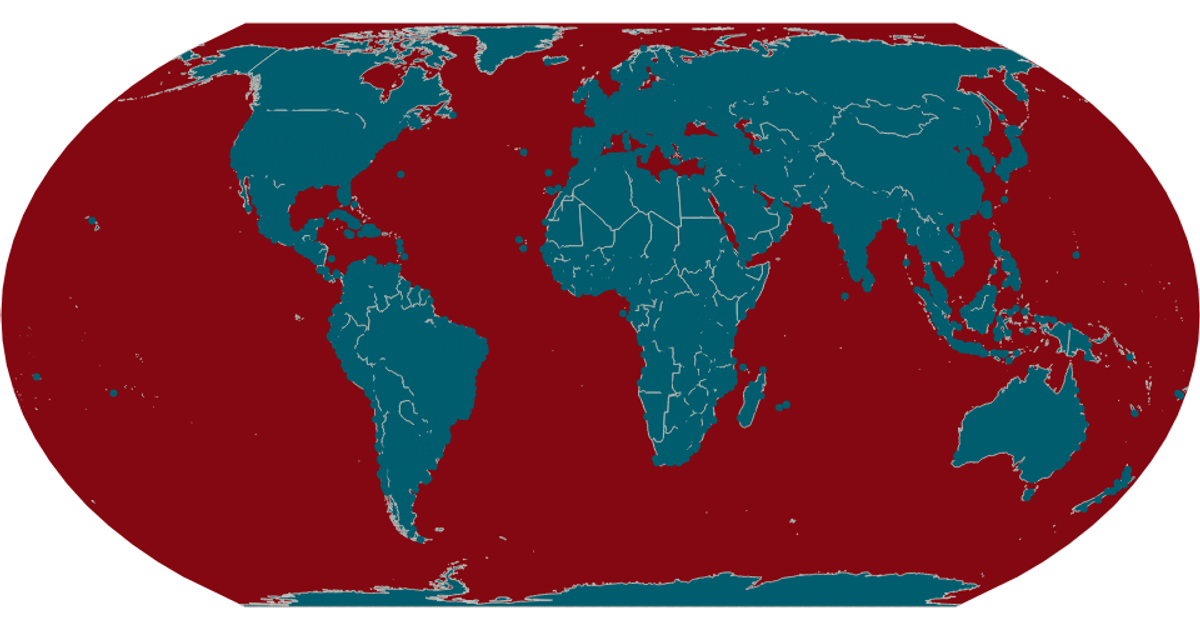
AI-generated descriptionA scatter plot of Data Canvas Sense Your City Dataset.
MIT Licensed




Comments
Sign in to join the discussion.