🌍 Public
Fork of ICE-6: Rendering Marks and Channels (Bar Chart)
Yyamunaunt
Last edited Mar 21, 2023
Created on Mar 21, 2023
Forked from ICE-6: Rendering Marks and Channels (Bar Chart)
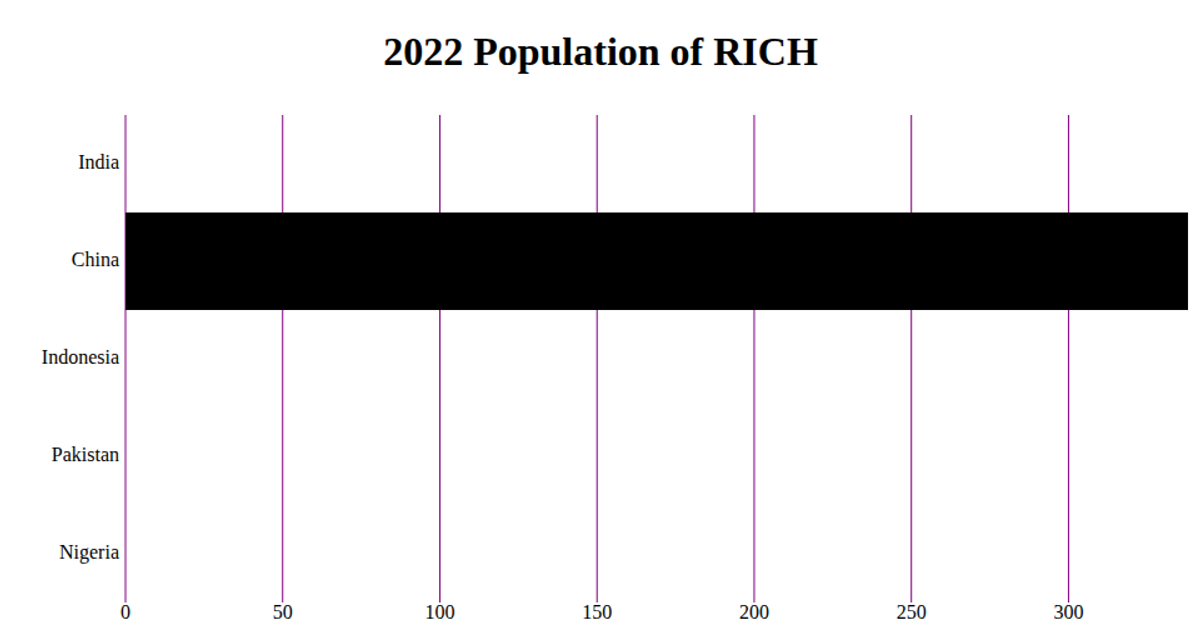
This bar chart displays the 2022 population of RICH, using horizontal bars to compare total deaths across the top three countries from a COVID-19 dataset. The visualization renders as an SVG within a React component, leveraging D3 v5 APIs including `scaleBand`, `scaleLinear`, `axisBottom`, and `axisLeft`. Data is loaded asynchronously via D3’s `csv` function from a GitHub gist, with only the first three records shown. Axes are drawn manually with tick marks and labels, while purple gridlines extend from the x-axis ticks.
AI-generated descriptionA bare minimum HTML page.
MIT Licensed




Comments
Sign in to join the discussion.