🌍 Public
Fork of Q2
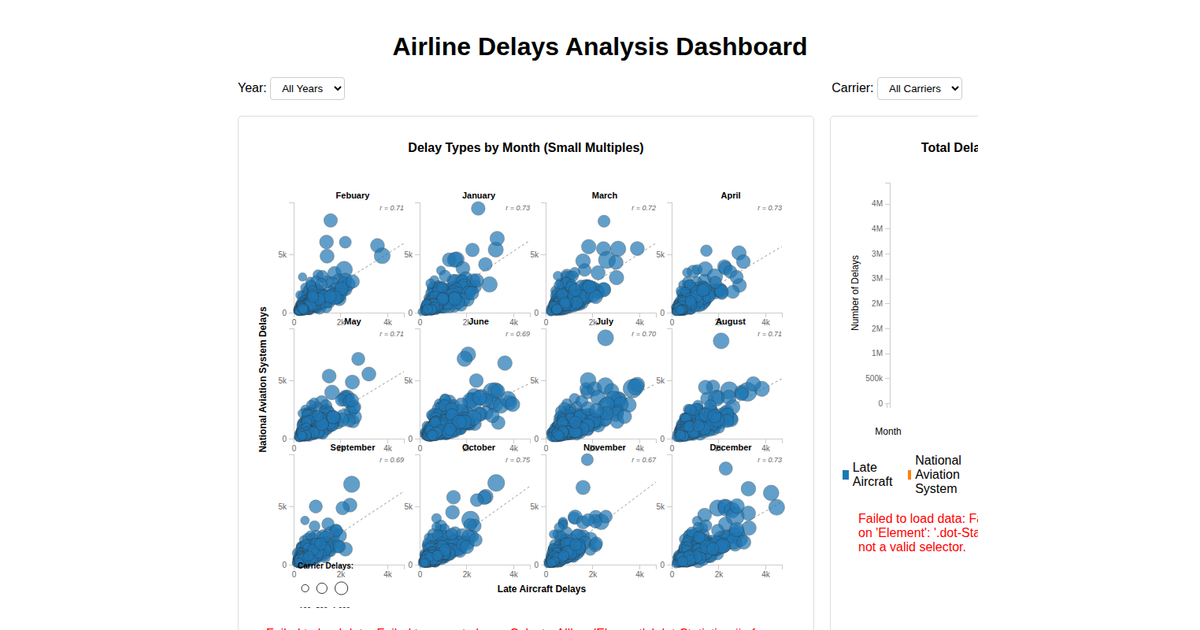
A network-style comparison of airline delay proportions is shown as a multi-series area chart, with each colored band representing a delay category. The visualization uses D3 v6, loading data from a CSV file and rendering with SVG. The code applies `d3.area`, `d3.scaleBand`, and `d3.scaleLinear` to position the areas, with a legend mapped from `d3.schemeCategory10`. Axes are labeled for airlines and delay proportion, and the data is fetched asynchronously via `d3.csv`.
AI-generated descriptionAn example showing the capabilities of VizHub:
- Loads D3 via UNPKG.
- Demonstrates use of
importfrom"d3". - Demonstrates use of
importfrom local ES6 modules.
MIT Licensed




Comments
Sign in to join the discussion.